Showing posts with label Rule of Thumb. Show all posts

Tuesday, 5 May 2026

Estimating Maximum Injection Pressure in Plastic Injection Molding (Rule of Thumb Plastics Processing)

Hello and welcome to a new blog post in which we’re sharing a practical rule of thumb for estimating the maximum injection pressure in plastics injection molding. 

It’s straightforward: take the minimum necessary injection pressure of your chosen polymer and simply multiply by 1.2. 

The result? Your maximum injection pressure.

Examples applying this rule

Let us look at a few examples with standard parts and medium-viscosity polymers:

  • Polyamide: Minimum pressure = 110 MPa → Maximum = 130 MPa
  • Polyethylene: Minimum = 100 MPa → Maximum = 120 MPa
  • Polycarbonate: Minimum = 120 MPa → Maximum = 150 MPa
Benefits:
  • It is a quick and easy way to estimate directly at your machine
  • Improves the process stability
  • Protects the machine and the mold

This simple approach helps you quickly estimate your injection molding parameters and ensures smoother processing—every time!

More Rules of Thumb can be found in my "start here" section. 

Thanks for reading & #findoutaboutplastics

Greetings, 

Herwig 

Literature: 

[1] Natti Rao: https://www.hanser-elibrary.com/doi/pdf/10.3139/9783446431492.fm

Friday, 17 April 2026

Condensation Polymers - The Importance of Resin Drying prior to Processing (Rule of Thumb)

Hello and welcome to a new Rule of Thumb post. 

For condensation polymers—such as PET, PC, PA, and PU proper resin drying is absolutely critical before processing. Why? These polymers contain reactive groups in their backbone (ester, amide, carbonate, or urethane) that can interact with even tiny amounts of moisture. 

If not thoroughly dried, water can trigger chain scission during processing at high temperatures (250–300°C), leading to a significant drop in molecular weight (Mw) and, ultimately, a loss of part performance and properties.

Even as little as 0.01% water can have a major impact, so special care must also be taken with regrind material, which can introduce additional moisture into the system. 


Figure 1: Polyester, Polyamide, Polycarbonate, and Polyurethane - Example of Chain Scission Due to Hydrolysis

As a rule of thumb, the molecular weight of condensation polymers should not decrease by more than 10%, since a 5% drop in Mw can already reduce properties by 10%. 

In contrast, addition polymers like PE and PP are more tolerant to molecular weight reduction, showing only minor property losses (5% property drop).

Understanding and controlling moisture is key to ensuring the quality and durability of your finished parts and prevent part failure. 

Check out my deep dive on functional groups here.

Thanks for reading & #findoutaboutplastics!

Greetings, 

Herwig 

Literature: 

[1] Ezrin M.: Plastics Failure Guide https://www.hanser-elibrary.com/doi/book/10.3139/9783446428829

[2] https://www.findoutaboutplastics.com/2026/04/the-11-functional-groups-of-polymers.html

[3] https://www.justerexpertwitness.com/case-directory

Tuesday, 7 April 2026

Estimation of Clamping Force in Injection Molding (Rule of Thumb)

Welcome to our latest blog post! 

If you’ve ever wondered how to choose the right injection molding machine for your project, understanding clamping force is key. 

Today, we’ll break down how to calculate the clamping force required for parts with wall thicknesses both below and above 1.5 mm. Mastering this calculation not only ensures high-quality parts but also helps you make smarter, more efficient equipment choices. 

Let’s dive in!

Case 1: part wall thickness below 1.5 mm

Clamping force F [kN] = projected area A [m2] * filling pressure pf [bar] / 100 

Filling pressure pf [bar] = Flow factor kf [bar/mm] * wall thickness factor kw [/] * flow length [mm]

Note: 1 bar = 1x10^5 Pa; Pa = N/m^2 = kg/(m x s^2) 

Flow factors kf depending which material one is using:

ABS: 2.0

PA: 2.0

PA+GF: 2.4

PBT: 2.0

PBT+GF: 2.3

PC: 2.0

PC+GF: 3.3

PE: 1.8

PESU: 3.7

PMMA: 1.8

POM: 2.4

PP: 1.2

PPO: 1.9

PPO+GF: 3.2

SAN: 1.8

PK (Polyketone): 1.2


Wall thickness factor kw:

0.4 mm: 11.9

0.5 mm: 9.2

0.6 mm: 7.3

0.8 mm: 4.5

1.0 mm: 3.0

1.2 mm: 2.1

1.4 mm: 1.5

1.6 mm: 1.1

Case 2: part wall thickness above 1.5 mm

Clamping force F [kN] = projected area A [m2] * pressure p [bar] / 100

Insert for pressure p:

Thermoplastics = 350 - 400 bar

Thermosets = 450 - 500 bar

Rubbers = 500 bar

Figure 1: Overview on clamping force estimation in injection molding.


Check out other Rules of Thumb posts here. 

Thanks for reading & #findoutaboutplastics

Greetings, 

Herwig 

Literature: 

[1] https://manuelkuehner.de/wp-content/uploads/2015/04/formelsammlung_polymertechnik_kunststofftechnik_hhn_manuel_kuehner.pdf

[2] https://firstmold.com/de/tips/clamping-force/

[3] https://prototool.com/de/injection-molding-formulas/

[4] https://www.justerexpertwitness.com/case-directory

[5] https://polymermaterialselection.com

Thursday, 5 March 2026

First-Principal Thinking in Polymer Engineering I A Powerful Tool covering innovation till problem solving I Rule of Thumb

Hello and welcome to this new blog post! 

First-principles thinking is a powerful problem-solving approach where you break down complex problems into their most basic, fundamental elements and then reassemble solutions from the ground up. It is part of one of my 20 mental models I use for effective thinking in polymer engineering. 

Mr. Michael Sepe, with his extraordinary contributions to the plastics industry as a teacher, expert, and consultant, was a strong believer in first principles thinking (Quote reported by Jeff J. :“the fundamentals don’t change” [1]).  By reading Michaels articles and books, I have learned a lot about polymer engineering and also the first-principles approach, which I would like to share with you in this post to keep the spirit of Michael among us!

How to apply First-principles thinking for your plastics challenges?

Instead of relying on analogies or established methods, you ask: “What do we know for sure?” and “What is truly essential?”

Here are some examples of first-principles thinking in polymer engineering and the plastics industry:

1. First principles approach on Understanding Material Performance

The performance of plastic materials is fundamentally determined by their structure. The polymer structure is defined by its molecular architecture, which directly affects key properties such as polarity, crystallinity, and viscoelasticity.

Molecular architecture can be divided into:

  • Molecular construction (including functional groups, branching, and tacticity)
    • Functional groups influence the polarity of the polymer.
    • Tacticity affects the crystallinity of the polymer.

  • Molecular weight (including molecular weight distribution)
    • Molecular weight distribution impacts the viscoelastic behavior of the material.

A plastic compound is composed of a base polymer and various additives. The characteristics of the base polymer are primarily determined by its molecular structure.

The final plastic compound defines the material’s mechanical, thermal, chemical, and environmental properties.  As a practical implication for polymer selection and design, you can pick the functional group for your target property: e.g., if you need high-temperature structural parts, aim for imide/sulfone/aryl ketone chemistries.

Figure 1 summarizes the first-principles approach on understanding plastic material performance. 

Figure 1: first-principles approach for understanding plastic material performance. 

2. Designing a New Polymer for a Specific Application

Traditional approach: Use existing polymers and modify them to fit the application. 

First-principles approach:

  • Start by asking: What are the fundamental properties required (e.g., thermal stability, flexibility, chemical resistance)?
  • Analyze the molecular structure-property relationships.
  • Design a polymer backbone and side groups from scratch to achieve the desired properties, rather than tweaking existing materials.
3. Reducing Plastic Waste

Traditional approach: Improve recycling rates using current technologies. 

First-principles approach:

  • Ask: What makes plastics hard to recycle? (e.g., immiscibility, additives, contamination)
  • Break down the recycling problem to its chemical and physical fundamentals.
  • Develop new polymers that are inherently easier to depolymerize or upcycle, or invent additives that enable closed-loop recycling.
4. Improving Barrier Properties in Packaging

Traditional approach: Add more layers or coatings to existing films. 

First-principles approach:

  • Ask: What fundamentally limits gas or moisture permeability?
  • Investigate the molecular interactions and free volume in the polymer matrix.
  • Engineer the polymer structure or blend with nanomaterials to minimize permeability at the molecular level, rather than just adding layers.
5. Coloring Polymers

Traditional approach: Use standard masterbatches and pigments. 

First-principles approach:

  • Ask: What causes color fading or poor dispersion?
  • Analyze the interaction between pigment molecules and polymer chains.
  • Design new pigment chemistries or surface treatments that bond better with the polymer, ensuring long-lasting and uniform color.
6. Lightweighting Automotive Parts

Traditional approach: Use existing glass-fiber reinforced polymers. 

First-principles approach:

  • Ask: What is the minimum material and structure needed for required strength and safety?
  • Use computational modeling to design new composite architectures or hybrid materials from the molecular level up, achieving strength with less material.
7. Developing Biodegradable Plastics

Traditional approach: Use known biodegradable polymers like PLA or PHA. 

First-principles approach:

  • Ask: What chemical bonds are most susceptible to environmental degradation?
  • Design new polymer structures with targeted weak links that break down under specific conditions, ensuring both performance and biodegradability.

In summary:

First-principles thinking in polymer engineering means questioning every assumption, understanding the science at the most basic level, and building innovative solutions from the ground up. It’s a mindset that can lead to breakthroughs in materials design, sustainability, and manufacturing.

For further reading, I recommend my mental models post which can be found here:

20 Mental Models for effective thinking in- and outside the plastics industry

Thanks for reading & #findoutaboutplastics

Greetings, 

Herwig

Literature:

[1] https://www.linkedin.com/posts/jeffrey-jansen_plastics-education-scholarship-activity-7224029479042482176-0wcT

[2] https://give.4spe.org/campaign/michael-p-sepe-memorial-scholarship/c604608

[3] https://www.findoutaboutplastics.com/2026/01/20-mental-models-for-effective-thinking.html

Thursday, 8 January 2026

Energy Consumption in Plastic Injection Molding: Hydraulic vs. Electric Machines (Rule of Thumb)

Hello and welcome to a new Rule of Thumb post (check out other Rule of Thumb posts here).

When it comes to plastic injection molding, energy efficiency is a key factor in both operational costs and sustainability. Let’s take a closer look at how different machine types compare:

If we set the energy consumption of traditional hydraulic injection molding machines with constant pumps as the baseline (100%), machines equipped with servo pumps already offer a significant improvement, consuming only about 54–55% of the energy. All-electric injection molding machines go even further, using just 48–49% of the energy compared to standard hydraulics.

However, machine selection should always be based on your specific production needs. In some cases, the part you want to mold may be better suited to a hydraulic machine with a servo pump, making this a perfectly valid choice despite the slightly higher energy usage.

In summary, while electric machines lead in energy efficiency, the best solution is always the one that fits your application requirements.

Figure 1: Energy consumption of hydraulic vs electric injection molding machines.

Literature: 

[1] https://www.findoutaboutplastics.com/2023/01/major-benefits-of-plastics-for.html


Wednesday, 22 October 2025

Stories From The Granulatefather: The Triangle Test

Stories from the Granulatefather: The Triangle Test by Herwig Juster

The hum of machines filled the air as Anna, a young design engineer, walked briskly through the plastics manufacturing plant. She clutched a sample part in her hand—a translucent connector for a medical device. It looked perfect, but Anna’s brow was furrowed. She had just received a report: several connectors had cracked during field use.

At the conference table, Anna met with her mentor, Mr. DeWitt, a seasoned materials expert. He examined the cracked part, turning it over in his hands. “Environmental stress cracking,” he murmured, almost to himself.

Anna sighed. “I thought we picked the right material. We even checked the chemical compatibility.”

Mr. DeWitt smiled gently. “Let me tell you a rule of thumb I learned early in my career. When it comes to environmental stress cracking—ESCR—think of a triangle. Three legs: environment, stress, and chemicals. If you can remove or reduce even one, you break the triangle and prevent failure.”

Anna leaned in, intrigued. “So, where do we start?”

They walked to the design lab. Mr. DeWitt pointed to the sharp corners on Anna’s part. “Stress concentrates here. Let’s round these edges and thicken the walls. That’ll help.”

Next, they reviewed the cleaning agents used in the hospital. “Some chemicals are harsher than we realized,” Anna noted. “We can recommend alternatives.”

Finally, Mr. DeWitt pulled a datasheet for PPSU, a high-performance polymer. “This material has excellent resistance to ESCR. It might cost more, but it could save us from future failures.”

A week later, Anna watched as the new connectors passed every test—no cracks, no failures. She smiled, remembering the triangle. By tweaking the design, rethinking the chemicals, and upgrading the material, they had broken the cycle of failure.

Anna’s story spread through the company, a reminder that in plastics, success isn’t just about picking a material—it’s about understanding the whole system, and knowing which leg of the triangle to break.

I hope you enjoyed the story!

Thanks for reading & #findoutaboutplastics

Greetings,

Herwig Juster


Tuesday, 21 October 2025

Don't Mix Maximum With Optimum Plastic Material Selection & Plastic Processing I Rule of Thumb

Hello and welcome to a new Rule of Thumb post discussing why mixing maximum with optimum in polymer material selection and plastics processing is not the best thing to do. 

Understanding “Maximum” vs. “Optimum” in Plastic Material Selection

When selecting materials, it’s important to distinguish between “maximum” and “optimum.”

Maximum refers to the highest possible value of a single property (e.g., the highest tensile strength, the greatest heat resistance, or the lowest density).

Optimum means the best possible balance among several relevant properties for a specific application. The optimum is not always the maximum of any single property, but rather the material that meets all key requirements most effectively.

Why is this distinction important?

Choosing a material based solely on a maximum value (such as the strongest or most heat-resistant polymer) can lead to unnecessary costs, processing difficulties, or other trade-offs. The optimal choice is the one that delivers the best overall performance for your specific needs—even if it doesn’t have the highest value in every category.

Example: “Optimal vs Maximum” in Plastic Material Selection

When selecting a plastic material for a specific application, engineers often seek the “optimal vs maximum”—that is, the best possible balance between competing requirements, such as mechanical strength, cost, processability, and chemical resistance.

Case Study: Gear Wheel for Automotive Application

Requirements:

  • High mechanical strength and stiffness
  • Good wear resistance
  • Dimensional stability at elevated temperatures
  • Cost-effectiveness for mass production

Material Candidates:

  • Polyamide 6 (PA6)
  • Polyoxymethylene (POM)
  • Polyetheretherketone (PEEK)

Selection Process:

  1. Define Key Properties:
    The gear must withstand high loads (tensile strength), resist wear, and maintain shape at temperatures up to 120°C.

  2. Score Materials:
    Each candidate is evaluated for tensile strength, wear resistance, heat deflection temperature, and cost.

Find the “Optimal vs Maximum”:

  • PA6: Good strength and cost, but absorbs moisture (affecting dimensions).
  • POM: Excellent wear resistance and dimensional stability, moderate strength, good cost.
  • PEEK: Outstanding properties, but very high cost.

After scoring, POM emerges as the “optimal vs maximum”—it offers the best compromise between performance and cost for this application, even though PEEK has higher absolute properties.

The “optimal vs maximum” is not always the material with the highest individual property, but the one that best meets all critical requirements for the application. In this case, POM is the optimal choice, delivering reliable performance at a reasonable cost.

Takeaway:
When selecting plastics, always look for the “optimal vs maximum”—the material that provides the best overall fit for your application, not just the highest value in a single property.

Optimum vs Maximum in injection molding

For example, in injection molding, the optimum flow rate is not necessarily the fastest possible, but rather the rate that minimizes shear stress, ensures proper mold filling, and avoids defects like air traps or weld lines. Similarly, the optimum temperature profile for a molding process might balance melt temperature for flow with cooling time for cycle time, while minimizing residual stress. 

Figure 1 presents the concept of "maximum vs optimum" for plastics processing. In essence, while maximum settings define the boundaries, optimum settings represent the sweet spot within those boundaries for achieving the best possible results in plastics processing.

Figure 1: Difference between optimum and maximum in plastics processing. 

More Rule of Thumb posts can be found here.

Thanks for reading & #findoutaboutplastics

Greetings,

Herwig Juster

Literature: 

[1] https://youtube.com/shorts/q_KfChgTwdM


Monday, 4 August 2025

How many cavities should you choose for your injection molding tool? I Rule of Thumb Polymer Processing

Hello and welcome to a new post. In today's post we discuss a community question I received:

How many cavities should you choose for your injection molding tool?

It’s a question that can make or break your project’s budget. Go too low, and you’re missing out on efficiency. Go too high, and tooling costs skyrocket.

Figure 1 [1] compares the cost of the injection mold, material, and injection molding as function of the mold cavities.  The sweet spot is at eight cavities as the optimal cavity number before costs start to climb. It is a classic "bathtub" cost curve and allows one to balance between tooling investment and production savings. 

Figure 1: Choosing the optimal umbers of mold cavities [1].

Conclusions

This curve serves as a first orientation. Important is that you collect all your costs and create such a total cost curve on your own. It depends if you are molding a packaging part, where more than eight cavities are beneficial, or if you are molding an engineering part such as a connector with pin overmolding, where fewer cavities may lead to an optimum already. 

Update - I received an interesting feedback: Prof. Jozsef Kovacs from University of Budapest highlights that László Sors developed a comprehensive analytical method for cavity number optimization as early as 1966, including equations, practical examples, and a nomogram. Sors’s work also addressed prototype molds, tool cost-efficiency, and the integration of thermal, rheological, and electrical calculations into mold design—well before these became industry standards. Sors is recognized as a pioneering figure in polymer tooling and design, leaving a significant legacy in the field. He published his know-how in the 1966 book: Műanyag-alakító szerszámok.

More "Rules of Thumb" posts can be found under "start here".

Thanks for reading & #findoutaboutplastics!

Greetings, 

Literature: 

[1] A. Pouzada: Design and Manufacturing of Plastics Products: Integrating Traditional Methods With Additive Manufacturing

[2] H. Juster: Optimizing your injection moulding production – my 5+ How’s I Plastics processing tips

Thursday, 10 April 2025

Mastering the Melt: Your Guide to Shear Rate Limits in Injection Moulding (Rule of Thumb)

Hello and welcome to a new Rule of Thumb post on plastics processing. In my previous post we discussed how to locate the maximum shear rates by using injection moulding fill simulations. Now we explore what shear rate limits we need to consider to not harm the processed polymer.

Rheology of polymers

Plastics exhibit non-Newtonian fluid behavior, where viscosity is dependent on the applied shear rate. In certain polymers, shear rate exerts a more significant influence on viscosity than temperature.

Under high stress conditions, such as during processing, polymer molecules align, leading to a substantial reduction and stabilization of the resin's viscosity. This phenomenon is known as shear thinning.

Injection moulding and shear rate / stress limit of polymer melts

In injection moulding, the injection rate or fill time directly correlates with the shear rate experienced by the plastic material. Fill time is a critical process parameter that affects shear heating and shear thinning.

Variations in fill time can alter the viscosity, pressure, and temperature of the polymer within the mould cavity, ultimately impacting the quality of the final part. Maintaining a consistent, optimized fill time is therefore crucial for process stability across different machines.

Excessive shear rates can induce polymer degradation, resulting in a decline in both the aesthetic and mechanical properties of the moulded component.

The shear rate within specific mould geometries, such as sprues, runners, and gates with a round cross-section, can be calculated using the formula: 

γ˙​=4Q​/Ï€r^3, where γ˙​ represents the shear rate (1/s), Q (mm^3/s) is the volumetric flow rate, and r (mm) is the radius of the channel.

Shear stress and shear limit control table

Calculated shear rate values can be compared against established material-specific shear rate limitations to identify potential processing issues related to excessive shear. This data facilitates the mathematical determination of optimal flow rates and mould design considerations. Your calculated shear rate should not exceed the shear rate limit  for the material. Figure 1 shows the shear stress and shear rates limits of different plastics, based on empirical experiments and literature. 

Figure 1: Shear stress and shear rate control table. 

Conclusion

In plastics processing, maximum shear rates can reach over 10,000 s⁻¹ in injection moulding and 1000 s⁻¹ in extrusion, with even higher rates (exceeding 1,000,000 s⁻¹) occurring in specific applications like wire coating. Calculating the shear rates of the material during processing and checking if they are below the shear rate limit of the material will lower the risk of polymer damage. Furthermore risk of plastic part failure is reduced since the part will have the desired properties. 

More Rule of Thumb posts can be found in the "Start here" section. 

Literature: 

[1] https://s3.amazonaws.com/entecpolymers.com/v3/uploads/pdfs/Rheology-vs-Shear-Rate-RGB.pdf

[2] https://www.findoutaboutplastics.com/2015/04/injection-molding-filling-simulation-my.html

[3] https://www.findoutaboutplastics.com/2022/05/6-benefits-of-injection-moulding.html

Monday, 18 September 2023

Rule of Thumb in Polymer Engineering: Connection between Glass Transition and Melting Temperature of Amorphous Thermoplastics

Hello and welcome to this Rule of Thumb post. More Rule of Thumb posts in polymer engineering can be found here. 

Often there are situations where the information on the glass transition temperature is useful to have at hand e.g. during material selection process or processing. There are different ways to obtain such information. The most accurate way is by measuring it with analysis methods such as DSC, DMA, and TMA. 

However, there is an empirical way for a fast estimation of the Tg of amorphous polymers: starting by the melting temperature of the polymer and multiplying it by ⅔ and you obtain the glass transition temperature range (Figure 1). 

Figure 1: Rule of Thumb in polymer engineering - estimating the Tg from Tm.


Example PVC

Polyvinylchloride, PVC,  has a glass transition temperature of 338.15 K and melting point at 485.15 K. Applying the Tg=2/3Tm rule results in an estimated Tg of 320.19 K. The difference to the measured Tg with tools such as DSC is only 5%. As I mentioned before, it is a quick estimation tool and a certain deviation need to be kept in mind. 

If you have interest in the Tg of engineering and high performance polymers - I made an overview which can be found here. 

Conclusions

Altogether, this rule of thumb serves as a fast adjustment approach when you do not have the exact information at hand. However, it seems to have a good fit with most amorphous resins (Tg above the 2/3 and 1/3 line; Figure 2) and can only be restricted applied to certain amorphous (PVC, PS, PC as examples) and semi-crystalline polymers. Furthermore, this Tg/Tm Rule of Thumb was proposed 70 years ago by Raymond F. Boyer (thanks to Pawel for this input) and it is still considered valid for polymers having both symmetrical and unsymmetrical molecular structures. However, later studies have found the ratio to vary widely, though.

Figure 2: selected amorphous polymers with their Tg and Tm as well as 2/3 and 1/3 line.

Thanks for reading and #findoutaboutplastics

Greetings, 

Herwig Juster

Literature:

[1] https://plasticranger.com/what-is-the-glass-transition-temperature-of-plastics/#What_is_a_rule_of_thumb_relating_Tg_to_TM

[2] https://www.researchgate.net/figure/DSC-melting-temperature-of-pure-PMMA-and-Ash-PMMA-composites_tbl1_262474618#:~:text=The%20coal%20ash%2FPMMA%20composite,the%20polymer%20matrix.%20...


Monday, 22 May 2023

Injection Moulding of POM - Checking Thermal Degradation (Rule of Thumb)


Injection Moulding of POM - Checking Thermal Degradation

Hello and welcome to this new Rule of Thumb post, discussing how to check the thermal degradation of Polyoxymethylene (POM) during injection moulding.

Setting the optimal melt temperature during processing is important for POM since it cannot be thermally stretched too much. Polymers such as Polyamide and Polyesters can handle higher set temperatures better during processing compared to POM which develops gases as result of degradation.

What are signs for thermal degradation? 
Typical signs of POM degradation are: 
-melt shows a foamy structure when leaving the injection nozzle
-it has a strong odor
-the nozzle tends to spill material out
-black and brown specks
-black flow lines on moulded part

How to test for thermal degradation?
Once moulding with POM has started and has run a couple of cycles, the machine will be stopped at the end of the dosing time. Now the machine stands still for 10 minutes (natural POM) or 2 minutes (coloured POM). After the waiting time is over, injection of the melt into the open is done. During ejection, check if there is formation of foam. After cooling down the melt cake, the swimming test is done. If the melt cake swims, then there is too much formation of foam and the material is thermally damaged. 

For POM, the recommended melt temperature is 215 +/-5ºC at which the melt for standard grades will remain stable without degradation (residence time is around 30 minutes).

More Rule of Thumb posts can be found here

Thank you for reading and #findoutaboutplastics
Greetings, 
[1] DuPont - Serie Teil 3: Spritzgießen von Polyoxymethylen (POM)

Tuesday, 4 April 2023

Thin Wall Moulding of Engineering Polymers (Rule of Thumb)

 Hello and welcome to this new Rule of Thumb post. Today we discuss the thin wall injection moulding of engineering polymers. 

High performance polymers such as PPS and LCP reach low viscosity levels at high injection moulding shear rates and temperatures. Other polymers such as Polycarbonate and Polymethyl methacrylate have a high melt viscosity, however flow properties can be improved by adding additives

Thin wall injection moulding with engineering polymers

The common wall thickness of engineering plastics ranges between 2 to 4 mm. Thin wall moulding focuses more on wall thickness below 2 mm. In general, the wall thickness influences the stiffness of the part, achievable flow lengths in the mould, cycle times, shrinkage, and weight of the part. Thin wall injection moulding results in high shear rates and injection pressures too. Drivers for thin wall parts are the Electric & Electronics, Automotive, and Telecommunication industries. 

How can we classify thin wall moulding in a quantitative way?

Spiral flow data is one way and is a good alternative to melt flow index (MFI) measurements. Another way of classification is over the flow length to wall thickness ratio (L/t). Since each polymer has different flow properties, the maximum achievable L/t ratios vary. Figure 1 shows the L/t ratio of commodity and engineering polymers based on a 2 mm wall section. Polyolefins, Polystyrenes, and ABS are good candidates for parts with 2 mm wall thickness and below. 

Figure 1: Maximum L/t of commodity and engineering polymers based on a 2 mm wall section.

More Rule of Thumb posts can be found here

Thanks for reading and #findoutaboutplastics

Greetings

Herwig Juster


Literature: 

[1] https://mastip.com/media/4274/thin-wall-moulding.pdf

[2] DuPont Design Guide

Monday, 6 March 2023

Rule of Thumb - Residence Time and Temperature Profile of Engineering Polymers

Hello and welcome to a new Rule of Thumb post. Today we discuss the importance of melt temperature and residence time of engineering polymers. Here the link to the residence time of high performance polymers. 

Melt temperature - injection moulding 

In general, melt temperature and residence time of the polymer melt are strongly linked and have a high impact on reaching the mechanical properties of your part. It is best to follow the recommendation of the material supplier for the optimal melt temperature. For example, if you decrease the melt temperature 10 Kelvin, starting from the recommended optimum value, tensile strength and elongation can drop 25 %. Reason are unmolten particles which enter the final part during moulding and cause a drop in mechanical properties.  On the other side, a 10 Kelvin increased melt temperature is not as critical as the lower temperature profile. The final part still will have 95% of the mechanical properties. The polymer melt can handle short increases in temperature which in turn leads to a better flow profile too. 

Residence time of engineering polymers - injection moulding 

Next to the temperature is the residence time. The biggest impact on the residence time has the size of your plasticizing unit and its optimal selection. If you have a high metering stroke, residence time is low. If you have only a small metering stroke, residence time will be up and you have to check if you are not above the maximum residence time of the polymer. It can encounter this by using an increasing temperature profile on your plasticizing unit. Figure 1 shows the maximum residence levels of different engineering polymers. POM and TPE can have high residence times (up to 30 minutes) and Polyesters (PET, PBT, PC) should not be much above 6 minutes in total residence time (including hot runners if applicable). 

Figure 1: residence time (minutes) of most used engineering polymers. 

I created also calculation tools which allows you to estimate the residence time for injection moulding and extrusion - here the link

Thanks for reading and #findoutaboutplastics

Greetings, 

Herwig Juster


[1] Kunststoff Taschenbuch - Hanser

[2] Serie Kunststoffpraxis Teil 12: Verweilzeit und Temperaturprofil - Plastverarbeiter 


Wednesday, 1 March 2023

Long Fiber Plastic Processing - How to Not Make Long Fibers Short (Rule of Thumb Series)

Hello and welcome to this blog post which is part of our Rule of Thumb series. Today we discuss the processing of long glass fiber plastic compounds using injection moulding. 

Long glass fiber (LFT) plastics 

LFT compounds have a fiber length between 9 mm and 12 mm and most are produced via pultrusion technique. Aim in processing is to keep the fiber length as long as possible since it is needed to build up a 3D-network consisting out of entanglements. Having an entangled system allows for high impact and strength properties as well as increased thermal performance of the final part. 

How to not make Long Fibers short - processing recommendations

In general we have to avoid excessive fiber breakage during all phases of injection moulding in order to have a long enough fiber length to form an entangled three dimensional network. 

1. Injection moulding setup: the feed hopper must be large with a slope angle of 45°; the hopper flanges do not need to be cooled and it is enough to have the same temperature as the feeding section of the barrel. A general three section screw can be used (screw diameter above 35 mm), however if possible use a longer feeding zone (> 60% of total length; compression and metering section 20 % length). Regarding the compression ratio, 2:1 or 2.5:1 is recommended. Avoid the use of mixing and shear elements along the screw sections. There are long-fiber screws available and they dramatically improve fiber length. Figure 1 compares the fiber length reduction over the different screw sections of a long-fiber screw and a standard 3 section screw. 

Figure 1: Glass fiber length reduction of a long-fiber screw and a standard screw [3]

2. Processing temperatures: in terms of processing temperature it is advantageous to have a temperature above the melting temperature before the compression section, together with the avoidance of shear heating. Avoid shut-off valves since they induce fiber breakage. Reduction of shear can be achieved by using a flat or reverse barrel temperature profile. Aim to ease melting in the compressing section. 

3. Plasticizing unit: keep the screw speed rotation in a low to medium range (< 100 RPM) together with low back pressure (0 to 10 bars). 

4. Injection moulds: reduction of glass fiber breaking is achieved by using large gate sizes (>80% of wall thickness). Proper venting of the tool will support weld line quality of the final part. Hot runner system can be used, however shut-off valves are not recommended.

5. Recycling: using post industrial waste or post consumer waste is possible up to 10 weight %. 

Additionally, most LFT parts I have seen had a fiber length between 2-3.5 mm and it was efficient enough to have 1.5 mm in average length for good strength properties. With 1.5 mm already ~80% of the strength was reached and after that it leveled off into a plateau with increased fiber length.

Key properties of LFT compounds can be found here and more Rule of Thumb posts here.

Thanks for reading and #findoutaboutplastics

Greetings

Herwig Juster


Literature:

[1] https://www.ptonline.com/articles/the-long-and-short-of-it-part-1tips-for-molding-long-fiber-reinforced-polymers

[2] https://www.solvay.com/en/brands/xencor-long-fiber-thermoplastics

[3] K. Kikikawa et.al.: History of development of injection molding machine technologies and future perspectives


/>

Tuesday, 7 February 2023

Rule of Thumb for Thermoplastic Material Design: 3 Effective Ways to Achieve ESD properties

Hello and welcome to this new Rule of Thumb post. Today we discuss three effective ways to achieve Electrostatic discharge (ESD) properties with thermoplastics. 

Overview and introduction to ESD 

In Europe the ATEX Directive (from the French "ATmosphère EXplosive") 94/9/EC contains regulations for the use of components and systems in potentially explosive atmospheres.

If an electrical discharge in a potentially explosive area (so-called EX area) produces the necessary ignition energy, a spark may be generated which ignites the explosive substance. 

Thermoplastics with specific conductive properties can discharge static charges in a controlled and permanent manner. They are used in many industrial sectors such as electric & electronics, semiconductor industry, medical technology, chemical and pharmaceutical industry, and other industries handling dusty bulk materials, combustible substances. It is important during polymer material selection to ensure the maximum safety for these applications by modifying the selected plastic.

Plastics are insulating and their electrical conductivity ranges between 10^-18 to 10^-12 Siemens per meter (S/m). In general plastics have an eclectic surface resistance of >10^15 Ohm and can be electrostatic loaded. Anti Static conductive behavior is achieved from 10^-9 to 10^-3 S/m with a corresponding resistance of 10^6 to 10^10 Ohm. For electromagnetic shielding (EMI), electrical conductivity of 10^3 to 10^9 S/m is needed. 

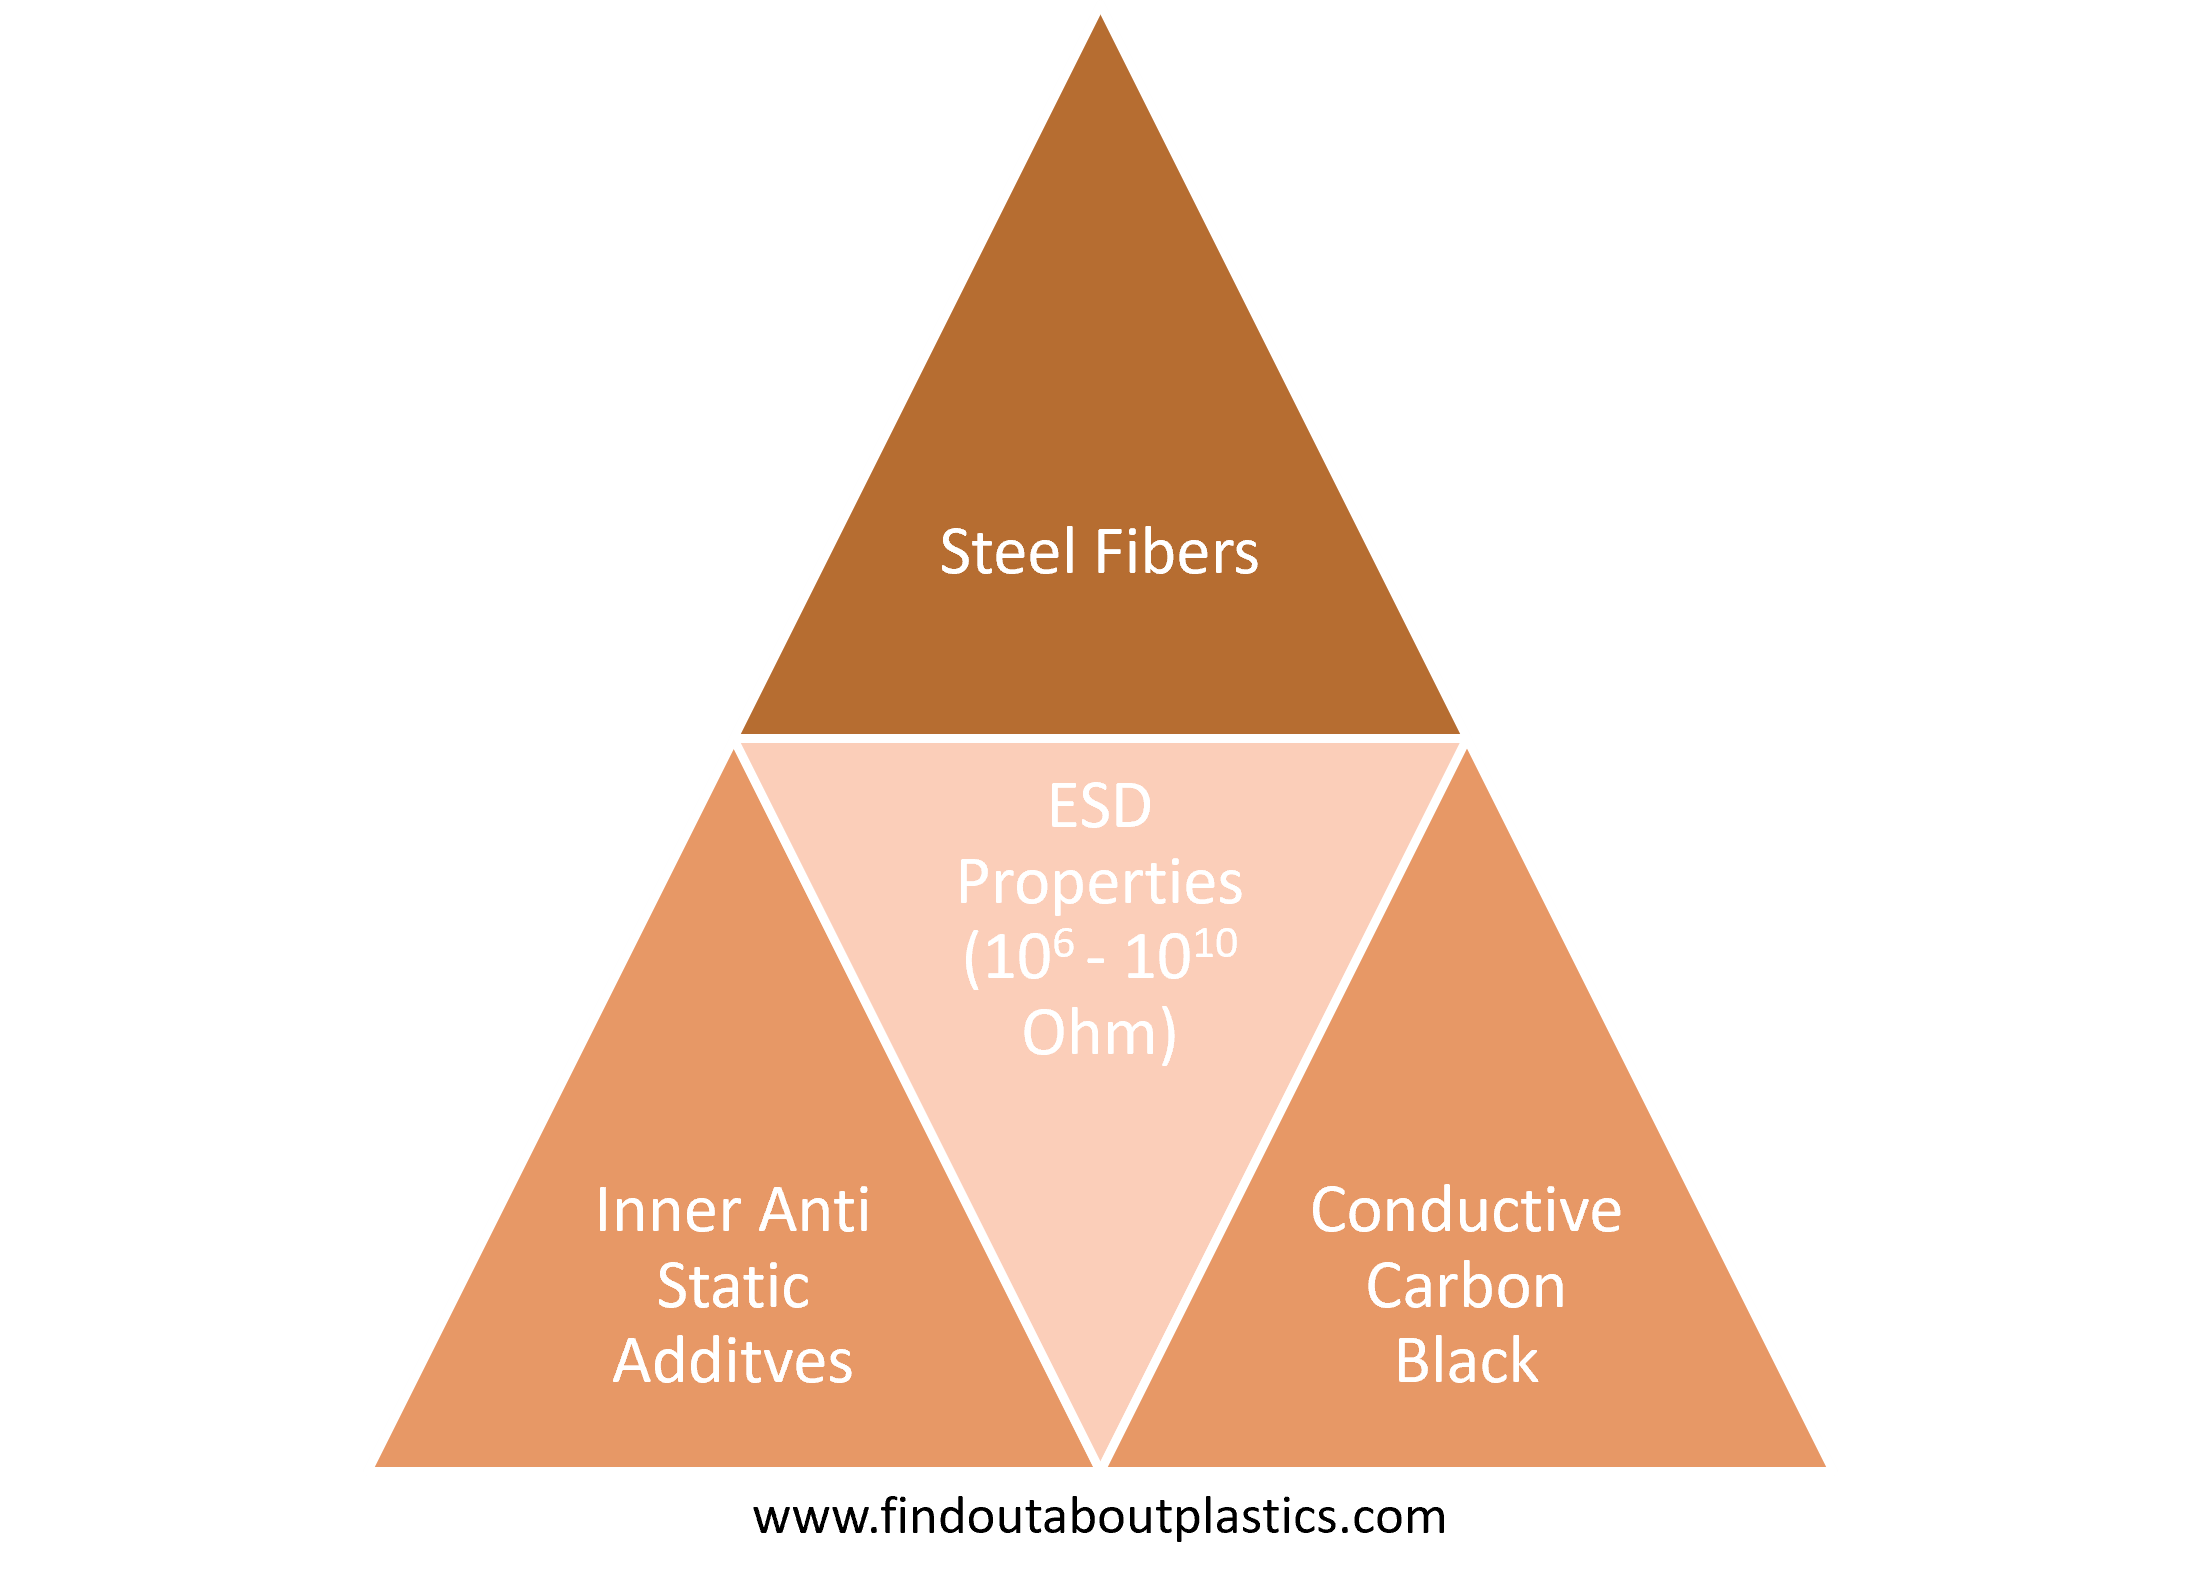
3 ways to have ESD properties in thermoplastics

3 effective ways to achieve ESD properties in thermoplastics

Stainless steel filler

Stainless steel fillers are an effective way to provide thermoplastic compounds with conductive properties. They can be directly added during injection moulding by a master batch or in a continuous way during compounding. 

Achieving ESD properties, 0.25-0.5 vol.% of steel fiber (4 w%) needs to be added. This is enough to have a volume resistivity of <10^2.

Inner anti static additives

Fatty acid esters and  Fatty acid amides are added either directly or over a masterbatch to the polymer compound. They migrate onto the surface of the finished plastic part and create a hydrophilic layer which in turn takes water up. The result is an electrically conductive outer layer. Anti static masterbatch concentration is between 3 to 50 w%.  Also, hydrophilic polymers such as Polyamidcopolymer can be added which results in a surface and volume conductivity. 

Conductive carbon black

Conductive carbon black in a concentration up to 15 w% is often used in polyolefin compounds. Specific volume resistance between 10^2 to 10^5 Ohm cm can be achieved. Apart of conductive carbon black, carbon fibers can be used too. 

More Rule of Thumb posts can be found in my "start here section".

Thank you and #findoutaboutplastics

Best regards, 
Herwig 


Literature:

[1] https://www.roechling.com/industrial/characteristics/esd-plastic

[2] https://www.bekaert.com/en/products/basic-materials/materials-plastic/esd-protected-plastics

[3] Sachtling Kunststoff Taschenbuch, Hanser