Friday 1 December 2023

Global Warming Potential (GWP) Reduction of Engineering and High Heat Plastics - Example PPS and PBT

 Hello and welcome to this blog post. Today we discuss how we can reduce the global warming potential (GWP) of engineering thermoplastics with the focus on Polybutylene terephthalate (PBT). Also we discuss how to reduce the GWP of Polyphenylene sulfide (PPS) by applying a replacement strategy. In another post we discussed the PPS GWP reduction in more detail. 

Effective ways to reduce the global warming potential (GWP) of thermoplastics

One way is to replace a high GWP polymer by a lower GWP one, and have at the same time a cost benefit as well as no reduction in performance. An example of this is the suggestion of material manufacturer Polyplastics to replace PPS components in the EV battery cooling system by low-cost long-glass fiber PP or POM [5]. PP has a GWP of 1.63 kg CO2 eq and POM has a GWP of 3.2 kg CO2 eq. Those are much lower compared to PPS with 5.46 kg CO2 eq or even higher in some cases. Reason which makes this change possible is that long-life coolants (LLC) for cooling batteries in EVs is maxim 100°C and for most time between 60 to 80°C, allowing PP and POM to take over this job. In this example we have a cost, and lower GWP advantage and keeping the needed performance. In addition, if one would like to keep the PPS and still lower the Carbon footprint, an effective way is to use recycled glass fibers. In detail we discussed this approach here

Another way to reduce the GWP of an existing polymer is to use recycling methods. This approach we discuss next. 

Using PET-bottles to reduce GWP of PBT 

It is possible to exchange fossil based raw material by post-consumer (PCR) PET bottle waste as feedstock in order to reduce the GWP of PBT. In our example, 60 wt% PCR PET bottles were up-cycled to a higher engineering PET which shows almost the same properties as a PBT resin based on 100% fossil feedstock. The carbon footprint could be reduced by 49% compared to the fossil based PBT.  Table 1 compares the properties of the standard PBT and low GWP PBT and Figure 1 shows the GWP reduction achieved with this up-cycled product. 

Figure 1: comparing the cradle-to-gate CO2 footprint of PBT and low-GWP PBT [1].


Table 1: Overview properties of PBT and low-GWP PBT [1].

Properties PBT (Valox) PBT low GWP (Valox iQ)
Tensile strength at yield (MPa) 54 50
Flexural stress at 5% strain (MPa) 85 82
Flexural modulus (MPa) 2500 2460
Notched Izod, 23°C (J/m) 35 35
Specific gravity 1.31 1.31
Tc (°C) 164 170
Tm (°C) 225 220
HDT, 0.45 MPa (°C) 155 150

Conclusions

Considering the GWP during your material selection journey is becoming more and more easier since material manufacturers start to up-cycle and recycle their products. Also, based on requirements, new low GWP and low cost materials can be used for traditional engineering and high performance polymer applications. 

Thanks and #findoutaboutplastics

Greetings, 

Herwig Juster

Interested in our material solutions - check out our product page here

Interested to talk with me about your polymer material selection, sustainability, and part design needs - here you can contact me 

Interested in my monthly blog posts – then subscribe here and receive my high performance polymers knowledge matrix.

Literature:

[1] https://www.researchgate.net/figure/58_tbl2_298399814

[2] https://www.researchgate.net/publication/298399814_Environmental_Benefits_of_post-consumer_recycled_PET_based_Valox_iQ_resin_vs_Valox_resin_using_Life_Cycle_Assessment_Approach

[3] https://www.findoutaboutplastics.com/2022/01/global-warming-potential-gwp-vs-thermal.html

[4] https://www.findoutaboutplastics.com/2021/12/eco-profiles-of-polymer-resins-global.html

[5] https://www.plasticstoday.com/automotive-and-mobility/ev-cooling-components-can-be-molded-less-heat-resistant-plastics


Monday 20 November 2023

Design Properties for Plastics Engineering: Polycarbonate Blends (Styrene and Polyester) and Their Thermal-Mechanical Properties

Hello and welcome to this design properties for plastics engineering post. As in this previous post given as an outlook, we continue today with blends of Polycarbonate with styrene and polyester polymers.

What are polymer blends?

Blends are made by mixing a polymer A with a polymer B. In case we can mix both polymers we will create a miscible blend with one glass transition temperature (Tg). In case the two polymers cannot be easily combined, an immiscible blend is created having two glass transition temperatures.  Examples of blends are PC/ABS, PC/ASA, PC/PBT, PC/AES, PPE/PS/PA, and PA/PPA. 

Why are polymer blends useful?

Polymer blends help to overcome the lack of some properties (flexibility, transparency, low density,...) which is needed for the application. They help to fulfil the product requirements. By blending of expensive polymers, lower overall material costs by a slightly changed property profile can be achieved too. 

Important properties of blends for part design - example impact performance

Polycarbonate shows excellent impact performance from room temperature up to 40°C (Figure 1). Below 0°C PC shows brittle behaviour and it shows that temperature influences the impact behaviour of polymers. The transition from brittle to ductile behaviour is very sudden. To avoid such a rapid transition, blending with ABS can be done. This allows it to have a more homogeneous behaviour at lower and higher temperatures. 

Figure 1: comparison of Izod Notched Impact test of PC, PC/ABS, and ABS. 

Important properties of blends for part design - example chemical resistance

Another example is the blend out of PC and the polyester PBT. Thoroughness and stability is offered by PC, however chemical resistance, especially towards solvents is limited. This is where PBT helps and provides enhanced solvent resistance. Using a PC/PBT blend in your application will result in a product which has good heat, chemical, and impact resistance. It covers impact performance at high temperatures as well as chemical resistance allowing this blend to be used for example as gear casing material in automotive.

Important properties of blends for part design - example increase flow for better part filling

Alloying amorphous polymers with semi-crystalline polymers increases also the flow rate which is an advantage during processing. A Polycarbonate has usually a melt flow of 10 g/10 minutes. If a blend in a ABS, flow rate can be increased to 15 g/10 min and by using a PBT it can be doubled to 20 g/10 minutes. 

Thermal-mechanical properties of blends: Dynamic Mechanical Analysis (DMA) of PC-blends

Figure 2 shows the DMA curves of ABS (Cycolac T), PC/ABS (Bayblend FR110), PC/PBT Xenoy 6123), PC/PBT with 10 wt% glass fiber (Xenoy 6240), and PC/PET (Makroblend UT1018). Advantages of using PC/ABS instead of PC alone is the enhanced processability and uniform impact behaviours (low and high temperature almost same). Using PC/PBT will enable applications where higher temperature performance, together with chemical resistance is needed. If higher mechanical properties are needed too, then adding 10 wt% glass fiber as reinforcement is enough to double the modulus of the blend over the temperature range. Furthermore, PC/PBT has a single glass transition temperature which is around 127°C, indicating the miscibility of the two polymers in the amorphous phase.

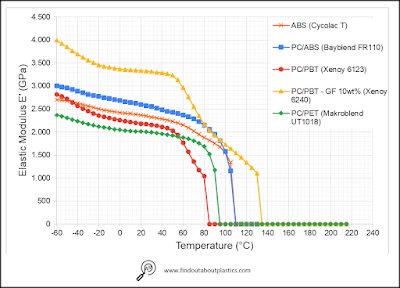
Figure 2: DMA of ABS, PC/ABS, PC/PBT, and PC/PET [5].

What other important PC-blends are available?

Apart from the aforementioned blends PC/ABS and PC/PBT, there are some more interesting PC blends such as PC/ASA and PC/AES: 

PC/ASA: great temperature stability, together with high UV resistance and can withstand cold temperatures without cracking. 

PC/AES: combining the strength, toughness, and heat resistance of Polycarbonate with the stress cracking and weather resistance of AES. Suitable for outdoor applications, building materials, and automotive components.

Table 1 compares major properties of PC/ASA and PC/AES to PC/ABS and PC/PBT. 

Table 1: Performance overview of PC blends [4].

PC Blend Tensile strength at yield (MPa) Tensile elongation at break Density (g/cm3) Heat deflection temperature at 1.8 MPa (°C) Notched Izod impact (J/m) Water adsorption (%)
PC/ASA (EnVoy 2506UR) 62 25 1.17 105 481 0.5
PC/AES (EnVelop 1812) 49 >60 1.12 96 641 0.25
PC/PBT (EnCounter F5PC/PBT10GF) 67 / 1.3 101 61 0.30
PC/ABS (EnValoy F0PC/ABS) 61 40 1.18 94 534 0.30


Conclusions

Blending PCs with different styrene polymers or polyesters help to overcome different property gaps in an efficient way. PC blends represent an important addition to the material selection toolbox which you can try out during your next project. 

If you have interest in testing PC blends and need some sample materials you can let me know here. 

Thanks and #findoutaboutplastics

Greetings, 

Herwig Juster

Interested in our material solutions - check out our product page here

Interested to talk with me about your polymer material selection, sustainability, and part design needs - here you can contact me 

Interested in my monthly blog posts – then subscribe here and receive my high performance polymers knowledge matrix.

Literature:

[1] https://www.youtube.com/watch?v=QrbHcEagUZM

[2] http://www.lookpolymers.com/pdf/Covestro-Bayblend-FR-110-PolycarbonateABS-Blend.pdf

[3] https://www.sabic.com/en/products/polymers/polycarbonate-pc-polybutylene-terephthalate-pbt/xenoy-resin

[4] https://encompolymers.com/

[5] M. Sepe: Dynamic Mechanical Analysis for Plastics Engineering, Elsevier

[6] https://www.findoutaboutplastics.com/2022/11/polymer-material-selection-how-can-flow.html


Friday 10 November 2023

Design Properties for Engineers: The ABCs of Polyarylamide (PARA; MXD6)

Hello and welcome back to another post on design properties for polymer engineers. Today’s session is dedicated to the high performance polymer PolyArylAmide (PARA or MXD6 or PAMXD6). Knowing about such a polymer can be an advantage during your next polymer material selection project, especially when dealing with high strength, stiffness, and cosmetic good appearance applications.

Introduction and structure - What are Polyarylamides? 

Polyarylamides belong to the group of  semi-aromatic Polyamides and have a glass transition point (Tg) of 85°C and a melting point of 235°C, and melt temperature of 280°C. They combine several interesting properties: 

-Lowest moisture uptake among aliphatic and semi-aromatic Polyamides

-High dimensional stability enabling complex parts

-Excellent surface appearance - “best-in-class” among the Polyamides

-Outstanding stiffened and strength

-Very good flowability which allows moulding of thin walls down to 0.5 mm and also for thicker walls without sinkmarks

Figure 1 shows the chemical composition of the PARA repetition unit and Figure 2 shows the DMA curve of a 60 wt% glass-fiber reinforced PARA (in comparison to PA 6.12- GF 60 wt%). It can be seen that up to the glass transition point, high modulus values of 18 GPa can be achieved followed by a decrease to a level of 10 GPa at 130°C. Long-chain aliphatic PA 6.12 can keep the high modulus of 16 GPa until 40°C and then the decrease takes place. Furthermore, it can be seen that PARA is not a typical high heat thermoplastic, it is more a high performance plastic, combining the aforementioned key characteristics.

Figure 1: chemical structure of PolyArylAmide (PARA; MXD6).

Figure 2: DMA curve of a 60 wt% glass-fiber reinforced PARA in comparison to PA 6.12- GF 60 wt%.

Characteristic properties of PARA

Let us circle back to the low moisture uptake. Comparing the moisture absorption of PARA, PPA, and standard aliphatic Polyamides, it can be shown that 50 wt% glass fiber reinforced PARA changes only 0.32% after 24-hour water immersion (at 23°C), whereas other semi-aromatic polyamides change twice and standard polyamides four times as much compared to the PARA value. 

Apart from the low water uptake, PARA offers the best surface among all Polyamides due to its fine crystallization in the surface regions. This makes it a good choice for coating or painting applications. Moulded parts in glass-fiber reinforced PARA achieve a low surface roughness value of 0.10 mu Ra  and standard Polyamides are around 0.25 mu. Mechanically polished steel has the equivalent surface roughness value as PARA. Among the Polyamides (aliphatic and semi-aromatic), PARA has the lowest surface roughness value. Reason is the fine crystallization of PARA in the surface layers of a moulded part.

The high stiffness and strength of PARA results from the fairly large molecule with its aromatic ring structures which entangle, together with glass fiber reinforcement. Table 1 compares mechanical properties of PARA to die casting metals. The mechanical performance of PARA favours it for metal replacement of applications which need high strength and excellent surface appearance. 


Table 1: Overview mechanical properties of Polyarylamide (PARA) compared to die-casting metals.

Properties PARA-GF 50 wt% PARA-GF 60 wt% AG6 (Al) AS9U3 (Al) ZAMAK (Zn) AZ91D (Mg)
Density (g/cm3) 1.64 1.77 2.7 2.9 6.6 1.83
Melting temperature (°C) 235 235 660 660 390 470
Tensile strength (MPa) 280 280 220 200 280 235
E-Modulus (GPa) 20 23 65 72 85 45
Elongation at break (%) 1.7 1.8 0.2 0.2 0.2 3.0

Design properties of PolyArylAmide (PARA)

Tensile Strength vs. Tensile Modulus
Figure 3 compares the tensile strength and tensile modulus of a PARA-GF 50wt% and a PARA-GF 60 wt% to die casting materials. If we now add the specific strength, it can be shown that it is higher up to two to three times compared to metals such as brass, zinc, and magnesium. 

Figure 3: comparison specific strength of PARA with glass fiber reinforcement to die-casting metals.

Creep Resistance at Elevated Temperatures
Figure 4 compares the creep performance of a 50 wt% glass fiber reinforced PARA to Zinc and Aluminum alloy. The data indicates that PARA deforms less than 1% after 1,000 hours (50 MPA and 50°C). PARA offers lower creep than most engineering polymers with similar reinforcement levels, as well as some metals. 

Figure 4: comparison creep resistance of glass fiber reinforced PARA to Zinc and Alumnium alloys [1].

Coefficient of Linear Thermal Expansion (CLTE) of PARA
Table 2 shows the CLTE value of a 50 wt% glass-fiber reinforced PARA, as well as metals such as steel, aluminum, brass, and zinc. 

Table 2: Coefficient of Linear Thermal Expansion (CLTE) of Polyarylamide (PARA) compared to die-casting metals.

CLTE (10-5 K-1) PARA-GF 50 wt% (flow direction) PARA-GF 50 wt% (transverse direction) Aluminium Brass Zinc Steel
/ 1.5 3.6 2.4 1.8 3 1.2

Warpage behaviour
Comparing the warping behaviour of PARA to standard Polyamides, a lower warping tendency of PARA can be found. Reason is the lower anisotropic behaviour of PARA which can be further improved with special mineral filler. 

Chemical resistance of PARA
Polyarylamides have an inherent good chemical resistance, however due to the amide group they show restrictions to some chemicals. Fast degradation takes place when exposed to powerful oxidants such as O3, and Cl2, as well as highly concentrated mineral acids such as H2SO4, and HNO3. Diluted mineral acids, acetic acid, and formic acid let to degradation at ambient temperature. Strong bases (KOH, NaOH, etc.), most organic acids, and formaldehyde lead to degradation of PARA at high temperatures.

Thermal and electrical properties of PARA
Apart from the DMA shown in Figure 2, PARA with 50 wt% glass fiber reinforcement has a heat deflection temperature (HDT; 1.8 MPa) of 230°C and an electrical Relative Thermal Index (RTI) of 130°C (at 1.5 mm). CTI of PARA-GF 50 wt% is PLC 1 class (500 V), volume resistivity is 1E+8 ohms cm  and dielectric strength is 28 kV/mm. Flame rating is HB at 0.75 mm.

Production of PARA
PARA is made by polycondensation of an aliphatic dicarboxylic acid (adipic acid) and an aliphatic diamine (1,3-Xylylendiamine).

Processing of PARA
Polyarylamides can be very well processed by injection moulding. PARA is not a typical high heat polymer, however the tool temperature during processing needs to be kept at 120°C. Advantage is that cyrstallization starts late during the moulding process, allowing to fill the cavities during the packing phase. PARA is a huge molecule, in comparison to other Polyamides, and therefore needs time to crystallize. It creates fine crystals, especially on the frozen upper and lower layer of the cavities and hides the glass fiber underneath. Therefore, a cosmetic surface with high glass fiber loading (50-60 wt%) can be achieved. Thin part moulding as well as complex part moulding is possible with PARA too. Figure 5 shows the spiral flow length of PARA at 1 mm thickness and 1000 bar injection pressure. It can be shown that PARA with glass filler loading flows as good as PPS (with glass and mineral filler), and 45% better than a standard Polyamide 6 with glass fiber reinforcement. There is also the risk of flash generation if venting and clamp force are not optimal set.

Figure 5: spiral flow results of PARA- GF 50 wt% in comparison to PPS and PA 6. 

Applications and end markets
Applications and markets of PARA range from appliances (f.e. handle of coffee machine, oven handles, coffee drip grids, and external housing components, combining structural and cosmetic requirements), medical devices (single-use surgical instruments f.e. inserters, curettes, needle holders, forceps, retractors and extractors.), aircraft (seating components), automotive (metal to plastic shift levers, painted parts) and electrics & electronics (mobile phone, tablets, and laptop components).

Commercial grades 
Table 3 shows the major manufacturers and commercial available compounds of PARA. Most of them offer glass-fiber reinforced grades (between 30 wt%-60 wt%), mineral filled grades, UV-light resistance grades, and flame retardant grades. Also carbon fiber reinforced grades are available. 

Table 3: Main producers of PARA and commercial compounds.

Manufacturer Commercial Name
Solvay Ixef®
Mitsubishi Engineering Plastics, MGC Reny®
Akro Compounds AKROLOY®PARA
TER Plastics TEREZ®GT2

Conclusions
This high performance polyamide combines several key properties: it has a metal-like strength (tensile modulus of 22 GPa at 50% glass loading, room temperature), high dimensional stability, takes up 87% less water compared to PA 6.6 and contains high modulus levels also after moisture pick up. It has the best surface appearance among all glass-fiber reinforced polyamides (resin rich surface due to fine crystallization). In addition, its excellent flow ability (similar to PPS) and ability to realize complex part geometries makes it a favorable material candidate during your material selection

Further data and reading
I published several interesting posts on PARA and in this post we discuss the difference between PARA and aliphatic Polyamides:

What to do next with all this information on PARA?
Now it is time to put the PARA and its data into practice. If you have a project where PARA may be a fit, I invite you to reach out to me and I will support you in the material selection process. You can enter a request over this form here or leave me a message here. 

Thanks for reading & #findoutaboutplastics

Greetings,

Herwig Juster

Interested in our material solutions - check out our product page here

Interested to talk with me about your polymer material selection, sustainability, and part design needs - here you can contact me 

Interested in my monthly blog posts – then subscribe here and receive my high performance polymers knowledge matrix.

Literature:


Friday 3 November 2023

Bio-Polyamides - Part 5: Performance Review of Short- and Long-Chain Aliphatic Homo- and Copolymer Bio-Polyamides

Bio-Polyamides Part 5: performance review. 

Hello and welcome to the fifth part of our Bio-Polyamide series. 

Check out Part 1, Part 2, Part 3, and Part 4 too.

In this post we discuss how to differentiate the performance of Bio-Polyamides in order to support you in your next polymer material selection project

A brief re-cap of Bio-Polyamides

In general we can distinguish between short- and long-chain aliphatic homo- and copolymer Polyamides. The term bio-based covers bio-based, biomass balanced or recycled content. 

PA 5.6 is the main Bio-Polyamide among the short-chain Polyamides and the pentamethylene diamine needed can be derived from biomass or sugar. 

Bio-PA 6 uses starch or sugar as base feedstock and over a fermentation process, caprolactam is obtained. Bio-PA 6 can be also mass-balanced and therefore used as a drop-in solution for replacing fossil based PA 6 allowing to reduce the carbon footprint from 6.7 CO2 eq/kg. to 4.52 kg CO2 eq/kg. 

For aliphatic long-chain homo- and copolymer Bio-Polyamides, castor oil is used to make sebacic acid. In case of PA 6.10 and PA 11, sebacic acid represents the 10 share of PA 6.10. In the case of PA 10.10, the first 10 is based on decamethylene diamine (DMDA) and the second 10 is again from sebacic acid. Obtaining DMDA is achieved by nitrile synthesis of sebacic acid. Standard Polyamides such as PA 6.6 and PA 12 can be replaced with such bio-based materials. 

Table 1 summarises the differences. 

Table 1: Overview differences in chemical structure of Bio-Polyamides [1].

Bio-Polyamide Monomer 1 Monomer 2 Raw material Bio-based carbon content (%)
Polyamide 6 (PA 6) ε-Caprolactam (mass-balanced) ε-Caprolactam (mass-balanced) Tall oil Mass-balanced
Polyamide 6.10 (PA 6.10) Hexamethylendiamine Sebacic acid (bio-feedstock) Castor oil 62 %
Polyamide 5.6 (PA 5.6) Pentamethylendiamine (bio-feedstock) Adipic acid Corn 41 %
Polyamide 11 (PA 11) 11-Aminoundecaoic acid (bio-feedstock) 11-Aminoundecaoic acid (bio-feedstock) Castor oil 92 %

Performance differentiation of Bio-Polyamides
Key chemical element of Polyamides is the amide group which facilitates internal hydrogen bonds between the different chains. Short-chain Polyamides have more amide linkages compared to the long-chain Polyamides and therefore outperform them in terms of thermal and mechanical properties. Downsides of the many amide links is the higher water uptake capability of short-chain Polyamides. The chemical and hydrolysis resistance of long-chain Polyamides is inherently better, combined with lower water uptake. There are many applications where hydrolysis resistance, combined with chemical resistance are more important than thermal and mechanical properties. 

Comparing mid to long chain bio-based Polyamides (PA 6.10, PA 10.10, PA 10.12, and PA 11) to fossil based short chain Polyamides (PA 6, PA 6.6), an outperformance in low water uptake and chemical resistance can be seen (Table 2). Furthermore, since bio-based Polyamides are shorter compared to their long chain fossil based peers such as PA 12, their mechanical strength and heat resistance is better than PA 12. 


Table 2: Performance overview of Bio-Polyamides [4].

Bio-Polyamide Bio-sourcing (% of C-Atom) GWP (kg CO2eq/kg) Glass transition temperature Tg (°C) Tensile strength (MPa) Tensile Modulus (MPa) Water adsorption (%)
Polyamide 6.10 (PA 6.10) 63 4.6 48 61 2100 2.9
Polyamide 10.10 (PA 10.10) 100 4 37 54 1800 1.8
Polyamide 10.12 (PA 10.12) 45 5.2 49 40 1400 1.6
Polyamide 11 (PA 11) 100 4.2 42 34 1100 1.9
Polyamide 10T (PA 10T) 50 6.9 125 73 2700 3
Polyamide 12 (PA 12) 0 6.9 138 45 1400 1.5
Polyamide 6 (PA 6) 0 9.1 47 80 3000 10.5

Amorphous (transparent) bio-based long-chain Polyamides
So far we discussed short- and long chain bio-based Polyamides classified as semi-crystalline. Apart from that, there are transparent long chain Bio-Polyamides based on PA 11 chemistry too. They can be an alternative to PMMA, PC, and PSU. In terms of properties, they offer higher environment stress crack resistance, chemical resistance, and fatigue resistance compared to PC and PMMA [7]. The perecentage of bio-based raw material ranges betwen 45% (Rilsan G850 Rnew; Tg = 150°C) and 62% (Rilsan G820 Rnew; Tg = 105°C) [7].

DMA of short- and long-chain aliphatic Polyamides
Another way to assess performance is to compare the elastic modulus E’ obtained by DMA of short- and long-chain aliphatic Polyamides. Figure 1 shows the elastic modulus E’ (always unfilled and DAm) of PA 6, PA 6.6, PA 12 and PA 6.12 (all fossil based). It can be seen that PA 6 and PA 6.6 are outperforming PA 6.12 and PA 12. PA 6.12 performs between PA 12 and PA 6 and can be a good compromise between thermal, mechanical and water uptake properties. 

Figure 1: elastic modulus E’ obtained by DMA of short- and long-chain aliphatic Polyamides [6].


Conclusions
Altogether we can state that in terms of performance, bio-based Polyamides can be placed between short-chain and long-chain fossil based Polyamides. Depending on the application requirements the bio-based version serves as a drop in solution (f.e. mass-balance PA 6), or is inferior or superior to the fossil-based peer. 

Check out Part 1Part 2Part 3, and Part 4 too.

Thanks for reading and #findoutaboutplastics!

Greetings

Herwig Juster

Interested in our material solutions - check out our product page here

Interested to talk with me about your polymer material selection, sustainability, and part design needs - here you can contact me 

Interested in my monthly blog posts – then subscribe here and receive my high performance polymers knowledge matrix.

Literature:
[1] https://akro-plastic.com/en/compounds/akromid-next
[2] https://www.findoutaboutplastics.com/2021/12/eco-profiles-of-polymer-resins-global.html
[3] https://www.k-aktuell.de/technologie/maurer-polyamide-mit-bioanteilen-100441/
[4] Bio-based plastics materials and applications by Stephan Kabasci 
[5] https://www.researchgate.net/publication/351965239_Bio-based_polyamide
[6] Dynamic Mechanical Analysis for Plastics Engineering by Sepe, M.P. 
[7] https://hpp.arkema.com/en/product-families/rilsan-polyamide-11-resins/rilsan-clear/

Wednesday 25 October 2023

Design Properties for Polymer Engineers: Weather and UV Resistance of Commodity and Engineering polymers (styrene copolymers and PMMA)

Hello and welcome to this blog post on weather and UV resistant engineering polymers. I have split this post in three sections (overview styrene polymer family and PMMA; design data; material selection) and it should be supporting you in your next material selection project.

Short overview of the styrene polymers family (styrenics) and Polymethylmethacrylate (PMMA)

Polystyrene (PS) is widely known as material for packaging and consumer goods applications has a good hydrolysis behaviour, however has low performance when exposed to UV-light and weathering.  It is an amorphous polymer and is fully transparent. Anti-UV agents and/or carbon black needs to be added in case it is used for exterior applications. Next to PS we have Styrene-acrylonitrile copolymer (SAN). Main impact is the amount of acrylonitrile. It can bes used between -20°C and 85°C, short time exposure till 95°C. It is a transparent polymer however it has a slight yellow impression. Therefore, soluble blue color is added to overcome this yellow appearance turning it into a slight bluish material. Adding glass-fibers to SAN will result in an engineering polymer (high stiffness, low shrinkage in-flow and cross-flow). In comparison to PS, SAN has a better weatherability performance which increases with the acrylonitrile amount. Downside is the rapid water uptake due to the polar nitrile group which makes proper drying before processing necessary. It is used in electrical engineering applications, automotive (lighting housing), and household goods. 

PMMA

Polymethylmethacrylate (PMMA; known by its famous trade name “Plexiglas”) is an amorphous thermoplastic material with a glass transition temperature of 105°C. It is a stiff and hard polymer, however relatively brittle. It has very good optical properties (light transmission up to 92%). PMMA has a six time better impact behaviour compared to silicate glass making it a good choice for applications where transparency and stability is needed. It has very good weatherability and ageing properties. It can be used from -40°C up to +75°C, with a short term maximum temperature of 100°C. 

Impact modified styrenics: ABS, ASA, and AES

Apart from PS and SAN, there is Acrylonitrile butadiene styrene (ABS). ABS is an amorphous polymer with a glass transition temperature of 105°C. It is made out of 3 different monomers: Acrylonitrile which provides heat resistance and chemical resistance to strong acids and bases; Butadiene which brings the good impact resistance as well as inferior low temperature resistance; and Styrene which allows ABS to be easily processed and gives it some rigidity. The impact resistance of ABS is around 5 to 10 times higher compared to PS. ABS can be used between -40°C and 85°C, with a short time peak temperature of 100°C. ABS has low resistance to weathering. Exchanging the butadiene rubber by ethylene propylene diene monomer (EPDM) rubber is an effective way to improve the weathering resistance of ABS. It is called acrylonitrile-(ethylene-propylene-diene)- styrene (AEPDS or AES). Also, using chlorinated polyethylene (PE-C) instead of butadiene has a similar effect. It is called acrylonitrile-(chlorinated polyethylene)-styrene (ACS). AES combines excellent weather resistance with low temperature resistance. It can be used for outdoor applications which are exposed to UV and impact. If we exchange the butadiene rubber of ABS with an acrylic rubber, we obtain  Acrylonitrile-styrene-acrylate (ASA) which does not contain a double bond in the rubber part. This in turn increases the weatherability and ageing in an effective way. Combing meythlmethaacralyte with ABS will result in MABS which shows excellent impact resistance at low temperatures and have a good light transparency. However, due to the butadiene rubber it is not suitable for outside applications (double bond in rubber). 

Check out my review post on ABS here (incl. Youtube video)  and here my short video on "ABS vs. ASA vs. AES". 

Figure 1 shows the polymer performance pyramid and the location of PS, SAN, ABS and PMMA in this pyramid relative to each other and Figure 2 provides an overview of the different combinations of styrenics and PMMA. Table 1 compares selected properties of PS, SAN, ABS, ASA, AES, and PMMA.

Figure 1: plastics performance pyramid containing PS, SAN, ABS, and PMMA.

Figure 2: overview of styrene polymers from base polymer to impact modification.

Table 1: property comparison of GPPS, SAN, PMMA, ABS, ASA, and AES.

Design properties for part design: weatherability and UV resistance of PMMA, ABS, and ASA

Mrs. Fatma Filiz Yildirim [4] investigated with her team the weathering methods on the properties of the ABS, ASA and PMMA. Testing was done by exposing the plastic parts to  natural weathering, Xenon-arc lamp, and UV fluorescent lamps for a certain period of time and then analyzed by grey scale (ISO 105-A02; 5 = low color change; 1 = high color change). Also, tensile strength was measured after exposure to natural weathering, Xenon-arc lamp, and UV fluorescent lamp. Figure 3, 4, and 5 show the results of the weathering study. The results indicate that PMMA has the best performance in all three weathering conditions. The xenon-arc lamp weathering method resulted in the lowest grey scale values for ABS and weathering by UV fluorescent lamps lead to the lowest grey scale with ASA samples. Reason for the change is the butadiene monomer containing double bonds which are broken up. This can be seen in the tensile strain values which change (materials harden and become brittle), whereas the tensile stress levels remain mostly at the same level for all three materials (Figure 6 and Figure 7). Using AES instead of ABS will allow you to have good high impact resistance (even at low temperatures) and UV resistance since the limitation by butadiene rubber is eliminated. 

Figure 3: color change (grey scale) of ABS, ASA, and PMMA in natural weathering conditions [4].


Figure 4: color change (grey scale) of ABS, ASA, and PMMA as a result of weathering by Xenon-arc lamp [4].


Figure 5: color change (grey scale) of ABS, ASA, and PMMA as a result of weathering by UV lamp [4].


Figure 6: change of tensile stress @ break after weathering with UV lamp of ABS, ASA, and PMMA [4].


Figure 7: change of tensile strain after weathering with UV lamp of ABS, ASA, and PMMA [4]. 

Material selection guideline for outdoor applications

Figure 8 presents a relative comparison of selected properties of SAN, PMMA, ABS, ASA, and AES for supporting the selection of materials for outdoor applications. In the next post we will add the blends of ABS, ASA, AES, and PBT with PC to this list. 

Figure 8: relative property comparison of SAN, PMMA, ABS, ASA, and AES.

Additionally, Table 2 compares the Global Warming Potential (GWP) of PS, SAN, ABS, and PMMA. The materials range in the range between >2 and <4 kg CO2 eq. which is compared to other engineering polymers such as Polyamide 6.6 (GWP 6.4 kg CO2 eq.) in a good range. GWP values can be still decreased by the usage of recycling materials and mass-balance approaches. 

Table 2: comparison Global Warming Potential (GWP) of PS, SAN, ABS, and PMMA [9].

Finally, Figure 9 compares the elastic modulus E' (DMA) of PMMA, SAN, ABS, and HIPS to each other. For deciding on the material at different application temperatures,  the whole DMA curve of a material should be considered. It allows you assessing materials’ properties under different temperatures. Allover, SAN offers 3 GPa modulus sup to 100°C, together with transparency, in case it is needed. 


Figure 9: comparing the elastic modulus E' of PMMA, ABS, SAN, and HIPS [10].


Conclusions

ABS is an allrounder material which can be used for a variety of applications. You can cover from vacuum cleaner housing, Lego bricks to automotive applications which need to be plated. Downside is the resistance towards UV and weatherability. In this case, ASA and AES can take over the job since they have a long term resistance towards weathering and UV light. If transparency is needed, PMMA will support you, together with MABS. 


Thanks for reading and #findoutaboutplastics!

Greetings

Herwig Juster

Interested to talk with me about your polymer material selection, sustainability, and part design needs - here you can contact me 

Interested in my monthly blog posts – then subscribe here and receive my high performance polymers knowledge matrix.

Literature:

[1]https://prlresins.com/products/pc-asa-resin/
[2] https://www.findoutaboutplastics.com/2021/07/relative-comparison-of-material.html
[3] http://www.finevinyl.co.kr/shop/item.php?it_id=fineasa_eng
[4] https://www.sciencedirect.com/science/article/pii/S0142941822000137
[5] https://www.mexpolimeros.com/eng/aes.html
[6] https://infostore.saiglobal.com/preview/98705298668.pdf?sku=878631_SAIG_NSAI_NSAI_2087957
[7] https://www.smithers.com/industries/materials/polymer/physical-testing/material-properties-testing/optical-and-color-properties#Greyscale%C2%A0color%20change%20testing
[8] https://encompolymers.com/products/
[9] https://www.findoutaboutplastics.com/2021/12/eco-profiles-of-polymer-resins-global.html
[10] M. Sepe - Dynamic Mechanical Analysis for Plastics Engineers. 

Monday 16 October 2023

Injection Moulding Tips - 6 Inputs for Reducing Flash Behaviour of Polyphenylene sulfide (PPS)

Hello and welcome to this post on injection moulding tips with the focus on flash reduction of PPS.

Let us get started. We will first discuss the possible causes of flash and then show possible solutions. 

What is flash in injection moulding?

In general, flash occurs when molten plastic flows out of the mould during injection and solidifies, causing a visible effect (Figure 1). 

Figure 1: visible flash on an injection moulded part.


Why flash can be an issue with PPS?

Since PPS is a high flow polymer, it is an excellent choice for thin walled injection moulded parts. Also, the good flow properties allow for high filling loads. The good flowability allows the PPS to flow during filling out of the cavities without too much effort. Figure 2 compares the spiral flow length of different PPS types to Polyamide 6 with 50 wt% glass fiber [based on 1,2]. The highly filled PPS (GF/MD 65 wt%) reaches 40% more in flow length compared to the PA 6 (GF 50 wt%).

Figure 2: comparison of spiral flow length (1 mm thickness) of different PPS compounds (incl. unfilled) vs. PA 6- GF 50 wt% [based on 1,2].


Reducing flash with PPS: possible causes vs solutions 

-Too high injection pressure -> decrease cutoff position, injection packing pressure, and injection time forward

-Too high injection rate -> decrease injection rate

-Too high polymer melt temperature -> decrease barrel temperature and lower backing pressure

-Too high mould temperature -> decrease mould temperature (min. 135-140 °C)

-Too low mould clamping force -> increase clamping force; alternatively check the possibly to move mould to larger injection moulding machine (higher possible clamping forces)

-Mould wearing during production and misalignment -> in the beginning of production , parts show no flash however during the production run flash occurs on parts. Check if mould steel is hard enough and cavity edges are not wearing. Also, checking correct alignment of the mould together with clean parting lines during moulding (no material sticking in parting area). 

Furthermore, there are PPS alloy compounds which have low flash properties and fast cycle times (f.e. Ryton PPS XK2340). 

Now I am curious, let me know - what are your tips to reduce flash when moulding polymers such as PPS?

Thanks for reading and #findoutaboutplastics!

Greetings

Herwig Juster

Interested to talk with me about your polymer material selection, sustainability, and part design needs - here you can contact me 

Interested in my monthly blog posts – then subscribe here and receive my high performance polymers knowledge matrix.

Literature:
[1] http://mold-technology4all.blogspot.com/2011/07/wall-thickness.html

[2] https://www.plastics.toray/technical/torelina/tec_017.html
[3] https://www.solvay.com/sites/g/files/srpend221/files/2018-10/Ryton-PPS-Processing-Guide_EN-v2.1_0.pdf