Sunday, 10 March 2019

Plastics Part Design: The Continuous Use Temperature of 124 Most Used Plastics


Hello and welcome to this blog post on the topic of continuous use temperature (CUT) of thermoplastics.

The maximum acceptable temperature for thermoplastics is one of the most critical requirements to be handled during your material selection. Above the maximum use temperature, mechanical properties (mainly tensile strength and impact strength) or electrical properties (dielectric strength) will drop significantly. On the other hand, long term retention of mechanical and other required properties over the product lifetime is crucial. Therefore, you need to be able to estimate your continuous use temperature.
Don’t worry; there are already methods out there which can assist you. There is the UL 746 which is used to calculate the Relative Temperature Index (RTI; measured in °C).

What is RTI?
Citation UL: “RTI is the temperature in °C, at which properties have decreased to 50% of their initial value after a long-term exposure to this temperature (100,000 hours)”.


The Table 1 below shows the maximum use temperature of 124 most used plastics and can assist you in your daily material selection.And below you can try out my newly developed app called "PolyTherm Selector" which allows you to select a plastic and as an output you get the Continuous Use Temperature (CUT) according UL 746B.


Table 1: Continuous Use / Service Temperature of 124 most used Plastics.

Polymer Name
Max Value (°C)
 according
UL 746 (RTI)
ABS - Acrylonitrile Butadiene Styrene
89.0
ABS Flame Retardant
95.0
ABS High Heat
110.0
ABS High Impact
100.0
ABS/PC Blend –
Acrylonitrile Butadiene Styrene/Polycarbonate Blend
110.0
ABS/PC Blend 20% Glass Fiber
110.0
ABS/PC Flame Retardant
110.0
ASA - Acrylonitrile Styrene Acrylate
90.0
ASA/PC Blend –
Acrylonitrile Styrene Acrylate/Polycarbonate Blend
110.0
ASA/PC Flame Retardant
110.0
ASA/PVC Blend –
Acrylonitrile Styrene Acrylate/Polyvinyl Chloride Blend
90.0
CA - Cellulose Acetate
95.0
CAB - Cellulose Acetate Butyrate
105.0
CP - Cellulose Proprionate
105.0
CPVC - Chlorinated Polyvinyl Chloride
100.0
ECTFE - Ethylene Chlorotrifluoroethylene
150.0
ETFE - Ethylene Tetrafluoroethylene
155.0
EVA - Ethylene Vinyl Acetate
70.0
EVOH - Ethylene Vinyl Alcohol
100.0
FEP - Fluorinated Ethylene Propylene
205.0
HDPE - High Density Polyethylene
120.0
HIPS - High Impact Polystyrene
80.0
HIPS Flame Retardant V0
80.0
Ionomer (Ethylene-Methyl Acrylate Copolymer)
48.0
LCP - Liquid Crystal Polymer
240.0
LCP Carbon Fiber-reinforced
240.0
LCP Glass Fiber-reinforced
240.0
LCP Mineral-filled
240.0
LDPE - Low Density Polyethylene
100.0
LLDPE - Linear Low Density Polyethylene
110.0
MABS - Transparent Acrylonitrile Butadiene Styrene
80.0
PA 46 - Polyamide 46
150.0
PA 46, 30% Glass Fiber
160.0
PA 6 - Polyamide 6
120.0
PA 6-10 - Polyamide 6-10
150.0
PA 66 - Polyamide 6-6
140.0
PA 66, 30% Glass Fiber
150.0
PA 66, 30% Mineral filled
140.0
PA 66, Impact Modified, 15-30% Glass Fiber
140.0
PA 66, Impact Modified
130.0
Polyamide semi-aromatic
135.0
PAI - Polyamide-Imide
280.0
PAI, 30% Glass Fiber
220.0
PAI, Low Friction
220.0
PAR - Polyarylate
130.0
PBT - Polybutylene Terephthalate
140.0
PBT, 30% Glass Fiber
140.0
PC (Polycarbonate) 20-40% Glass Fiber
125.0
PC (Polycarbonate) 20-40% Glass Fiber Flame Retardant
125.0
PC - Polycarbonate, high heat
140.0
PC/PBT Blend –
Polycarbonate/Polybutylene Terephthalate Blend
121.0
PC/PBT blend, Glass Filled
193.0
PCL - Polycaprolactone
45.0
PCTFE - Polymonochlorotrifluoroethylene
175.0
PE - Polyethylene 30% Glass Fiber
130.0
PEEK - Polyetheretherketone
260.0
PEEK 30% Carbon Fiber-reinforced
240.0
PEEK 30% Glass Fiber-reinforced
240.0
PEI - Polyetherimide
170.0
PEI, 30% Glass Fiber-reinforced
170.0
PEI, Mineral Filled
170.0
PESU - Polyethersulfone
180.0
PESU 10-30% glass fiber
180.0
PET - Polyethylene Terephtalate
140.0
PET, 30% Glass Fiber-reinforced
140.0
PET, 30/35% Glass Fiber-reinforced, Impact Modified
140.0
PETG - Polyethylene Terephtalate Glycol
63.0
PFA - Perfluoroalkoxy
260.0
PHB-V(5% valerate)
95.0
PI - Polyimide
360.0
PMMA - Polymethylmethacrylate/Acrylic
90.0
PMMA (Acrylic) High Heat
150.0
PMMA (Acrylic) Impact Modified
90.0
PMP - Polymethylpentene
110.0
PMP 30% Glass Fiber-reinforced
110.0
PMP Mineral Filled
110.0
POM - Polyoxymethylene (Acetal)
105.0
POM (Acetal) Impact Modified
100.0
POM (Acetal) Low Friction
105.0
POM (Acetal) Mineral Filled
105.0
PP - Polypropylene 10-20% Glass Fiber
130.0
PP, 10-40% Mineral Filled
130.0
PP, 10-40% Talc Filled
130.0
PP, 30-40% Glass Fiber-reinforced
130.0
PP (Polypropylene) Copolymer
130.0
PP (Polypropylene) Homopolymer
130.0
PP, Impact Modified
115.0
PPA - Polyphthalamide
140.0
PPA, 30% Mineral-filled
156.0
PPA, 33% Glass Fiber-reinforced
186.0
PPA, 45% Glass Fiber-reinforced
186.0
PPE - Polyphenylene Ether
110.0
PPE, 30% Glass Fiber-reinforced
110.0
PPE, Flame Retardant
110.0
PPE, Impact Modified
110.0
PPE, Mineral Filled
110.0
PPS - Polyphenylene Sulfide
220.0
PPS, 20-30% Glass Fiber-reinforced
220.0
PPS, 40% Glass Fiber-reinforced
220.0
PPS, Conductive
220.0
PPS, Glass fiber & Mineral-filled
220.0
PPSU - Polyphenylene Sulfone
210.0
PS (Polystyrene) 30% glass fiber
122.0
PS (Polystyrene) Crystal
80.0
PS, High Heat
90.0
PSU - Polysulfone
180.0
PSU, 30% Glass finer-reinforced
180.0
PSU Mineral Filled
150.0
PTFE - Polytetrafluoroethylene
290.0
PTFE, 25% Glass Fiber-reinforced
260.0
PVC (Polyvinyl Chloride), 20% Glass Fiber-reinforced
80.0
PVC, Plasticized
80.0
PVC, Plasticized Filled
80.0
PVC Rigid
80.0
PVDC - Polyvinylidene Chloride
90.0
PVDF - Polyvinylidene Fluoride
150.0
SAN - Styrene Acrylonitrile
95.0
SAN, 20% Glass Fiber-reinforced
95.0
SMA - Styrene Maleic Anhydride
100.0
SMA, 20% Glass Fiber-reinforced
100.0
SMA, Flame Retardant V0
100.0
SMMA - Styrene Methyl Methacrylate
100.0
UHMWPE - Ultra High Molecular Weight Polyethylene
130.0
XLPE - Crosslinked Polyethylene
82.0


Thanks for reading and #findoutaboutplastics

Greetings

Literature:

1. https://omnexus.specialchem.com/
2. Saechtling Kunststoff Taschenbuch by Erwin Baur
3. UL 746B

Thursday, 21 February 2019

Plastics Recycling - What 1 Metric Ton of Recycled Plastics Can Spare [Infographic]


For further information check out my post on sustainability in the plastics industry: an overview and definitions.

Thanks for reading and till next time.
Best regards,
Herwig Juster


Don't miss out on my monthly posts and subscribe here.
More infographs you can find here.

Thursday, 31 January 2019

Metal-2-Plastic in Automotive: How to do it. (incl. Youtube Training Video)

Hello and welcome to this blog post where I show you how effective metal replacement with polymeric materials in automotive is done. A successful metal to plastic conversion can significantly reduce weight and CO2 emissions and increase mileage.

The training consists of 5 parts:
1. Update on the current challenges in the automotive industry
2. Clarification on why aluminum die cast replacement is beneficial
3. Deep dive on how metal replacement can look like including which high performance plastics can be used.
4. Explanation of metal replacement with a commercial example
5. Closure with key takeaways

Watch below the video on my Youtube channel:


1. Update on the current challenges in the automotive industry

Modern cars are gaining in weight and size. In the past 50 years, the weight increase was in average 10 kg per year. Globally, legislations are pushing Original Equipment Manufacturers (OEM’s) to design for better fuel economy, lower emissions and improved safety. In parallel, consumers are seeking a better performance of their cars at lower costs. And in all this discussions comes now the central question: why is applying light weighting beneficial?
A suitable light weighting strategy in place allows OEM’s to fulfill regulations and consumer wishes such as active safety, customer experience, new energy vehicles and reduction emissions.
In Figure 1 the current regulation situation is shown. In the European Union (EU) only 95 g/km CO2 will be allowed by 2020. The EU has the strictest of all CO2 emissions limits. OEM’s have to pay high fees for their cars if those are not fulfilled. Currently, the new Worldwide Harmonized Light Vehicle Test Procedure (WLTP) pushes OEM’s even faster to improve their fuel economy. It is expected that China is moving fast in such a direction too.


Figure 1: Overview on the worldwide CO2 regulations for automotive industry.

The statement of Goldman Sachs sums it up in a concise way: “We expect a 15% (200 kg) drop in the average car body weight by 2025 as automaker race to meet CO2 rules”. The modern cars need to loose around 200 kg in weight. One way is to switch to aluminum which has 1/3 of the weight of steel. Another way is to increase plastics in the body in white structures (Figure 2).


Figure 2: Results of Goldman Sachs study.
Currently around 10-12 % of a modern passenger car is made out of plastics. Comparing the different structural materials used in cars, advantages of polymeric materials can immediately be seen. Steel has a density of 7.8 g/cm3. Aluminum has 1/3 the density of steel and plastics have half the density of aluminum, leading to a 50% reduction.


2. Why is aluminum die cast replacement beneficial?

In this section I show you why metal replacement with polymeric materials is beneficial for consumers and OEM’s. On one hand, aluminum prices increased 33% in the past three years (Figure 3). On the other hand, due to the significantly lower density of polymers in comparison with metals major weight reduction can be achieved.


Figure 3: Volatile material prices of LME aluminum.

Some of the technical advantages of replacing metals with plastics are for example:
1) Possibility of consolidating several metal parts into one plastic part.
2) Better resistance to corrosion or chemical attacks
3) Better acoustics (particularly relevant in electric vehicles)
4) Improved friction and wear properties of parts

So far, we made a quality assessment of why metal replacements in automotive are beneficial. Now, we make a direct quantitative comparison with a split into process, part and additional advantages (Figure 4). As an aluminum representative I have selected the alloy A380 and compared it to high performance plastics such as polyphtalamides (PPA), polyarylamide (PARA), and polyphenylene sulfide (PPS). I highlighted the major differences in orange. Manufacturing process for aluminum parts is in most cases a die-casting process which requires high operating temperatures. Aluminum allows parts with high dimensional tolerances and the casting is close to net shape. For plastics injection moulding can be used to ensure a high volume mass production at high production efficiency. As a result, besides allowing 50% lighter parts than aluminum, plastics may allow for cost reductions in the order of 10 to 30%. On the top of these advantages is the design freedom and linear performance up to 120-150 °C e.g. semi-aromatic nylons and PPS.


Figure 4: direct comparison of aluminum A380 and high performance plastics.

3. How a metal replacement can look using high performance plastics
Here, we discuss the plastic material selection for metal replacement. There are over 60 thermoplastic resins and over 100 additives you can add to your base resin, ending up with thousands of potential compounds. Therefore, you might ask: which of those compounds is the optimal material for my metal replacement? Basically, a selection method consisting out of three steps will help you to find the right polymeric material. In a first step, we will select the resin morphology, deciding if we need an amorphous or semi-crystalline morphology. Then, in the second step we apply thermal, mechanical and cost requirements. Finally, in the last step the manufacturing process is considered and a final review is made (Figure 5).


Figure 5: material selection steps for metal replacement.

Amorphous and semi-crystalline polymers have their strength in different areas. Amorphous resins have excellent transparency combined with low shrinkage; low warpage and tight part tolerances can be achieved. Semi-crystalline resins have an easy processing behavior combined with chemical resistance, mechanical strength and wear resistance. To be suitable for metal replacement in automotive a plastic parts has to exhibit certain mechanical strength and wear resistance and has to be able to withstand oils and fuels. Therefore, semi-crystalline morphology will be the clear choice. For most metal replacements at least the temperature stability and mechanical strength level of an engineering plastic is required. Figure 6 shows you the major commodity, engineering, and high performance plastics.


Figure 6: Overview of major commodity, engineering, and high performance plastics.

In the second step, the thermal, mechanical, and cost requirements are evaluated. An important criterion to rank materials in relation to each other is the strength to weight ratio (Figure 7). Comparing the aluminum grade A380 with the engineering and high performance plastics, it can be seen that Nylon 6.6 and PPS are in a similar strength to weight range. PARA as well as PPA with 60% glass fiber are even outperforming aluminum.


Figure 7: Strength to weight ratio of different metals and plastics.

So far we just considered values of our materials at room temperature. How PPA and PARA behave at higher temperatures? In Figure 8 you can see that PARA is not a high temperature polymer since it has a glass transition of 85°C. PPA’s, however, have higher glass transitions which can reach up to 135°C and higher. For standard operating environments, both materials are suitable for an aluminum die cast replacement.


Figure 8: Tensile strength of semi-aromatic Nylons and aluminum.

In the last step of the material selection we have to check the processing methods of the selected materials. Most parts are produced in injection moulding which comes with several benefits such as reduced post processing costs and moulded in threads if needed. Apart of material selection we have to consider some more things for our project management to be successful in metal replacement. One point is the definition of the primary aims: which functions need to be fulfilled by the system and which function does each single component need to fulfill. Another step is the product conceptualization: here it is important to look for design alternatives, feasibility studies, potential savings, and test programs with prototype parts. Design in plastics is not difficult, it is just different. Design checks are needed to find out if there are no critical weldline situations. Part optimization by using e.g. moldflow studies combining with practical filling studies can be beneficial too. Finally, evaluation of the material suitability through test specimens and component testing should be done. After this your new plastic part can be ready for a pre-series test – congratulations when you reach this phase.

4. Explaining metal replacement with a commercial example
Now let’s close the theoretical part and have a look at an industrial example. Engine support mounts are a good example for metal replacement. In this case a PA6.6 with 60 % glass fiber load was selected (Figure 9). It is a high strength type of Nylon and having a specific strength in the range of steel which makes it a good candidate for replacement.


Figure 9: Engine support mounts as a metal replacement example.


5. Key take aways
In Figure 10 I summarized what we have discussed in this post:

Figure 10: key takeaways of the metal to plastic training.


Thanks for reading this training and if you have questions or need help with your metal replacement, then please let me know.


Greetings & till next time!
Herwig Juster


New to my Find Out About Plastics Blog – check out the start here section

Monday, 31 December 2018

Dynamic Mechanical Analysis (DMA) as a Polymer Material Selection Tool


Dynamic mechanical analysis (DMA) provides insights into the mechanical behavior of a material under different conditions. Therefore, it is a powerful tool for polymeric materials selection. In this blog post, I show you why and how you can benefit of it. Polymeric materials are based on long chains of repeating units with inherent high molecular weight. In thermoplastics, the polymer chains are to certain extent entangled. However, they are not chemically bonded to one other, which means they have certain degree of mobility. For instances, disentanglement of the polymer chains can lead to failure of a polymer-based part.

What is DMA?

At its core, DMA is a thermomechanical analytical method that estimates the viscoelastic properties of a given material. It allows you to gain insights into the temperature and time dependency of the tested material. This is achieved by measuring the modulus as a function of temperature, time, or frequency. As a result you will obtain the storage or elastic modulus (E’), the loss or viscous modulus (E’’), and the tangent of the phase angle delta (E’/E’’). In this blog post, I will focus especially on temperature-dependency. During testing some sort of deformation i.e. tension, shear, compression, torsion, or flexure, is applied on the sample material and the modulus is measured. As a result, the material’s elastic modulus (E’) can be plotted against different temperatures. This can be helpful to evaluate the mechanical properties of an existing polymeric part over its service temperature range as well as to decide upon most suitable material to choose according to the application service temperature demands.

What happens on a molecular level?

Most molecular transitions can be made transparent by DMA. For understanding this better, we can have a look at the so-called crankshaft model which explains the molecular chains as a series of joints with emphasis on the change of free volume [2]. There are also more detailed models such as the Doi-Edwards model.


In Figure 1, I sketched the different types of molecular motions and how they are linked to the different temperature transitions. Main movements are slipping of chains, i.e. rotation, bending, and stretching. The gamma transition (Tγ) is the first transition away of the solid state where the first movements of atoms are noticed. With increasing temperature, a secondary transition, also called beta transition (Tβ) happens. Here, 4 - 8 backbone atoms are able to move. Polymers can develop toughness due to increased movement of side chains. With further increase of the temperature the alpha transition (Tα), also called glass transition (Tg). In this case, more than 40 backbone atoms are able to move and mechanical properties drop by one to two powers of ten.

Figure 1: Crankshaft model and type of molecular motions [2].


DMA in action: a useful tool for better decision making in polymer material selection


Let’s have a look at some results of DMA. Figure 2 shows the elastic modulus as a function of temperature for an amorphous polymer such as polycarbonate (PC) and a semi-crystalline polymer such as Nylon (e.g. PA 6). Amorphous polymers show a steep drop in modulus in the region of the glass transition temperature. This is for PC 147°C. For semi-crystalline polymers, such as PA 6 there is also a decrease in modulus at the glass transition temperature, in this case 47 °C. However, in contrast to PC some degree of mechanical strength can be retained from 80 to 180 °C until the crystalline melting temperature of 220 °C is eventually reached.

Figure 2: DMA of an amorphous and a semi-crystalline polymer [1].


Figure 3 shows the elastic modulus as a function of temperature of highly glass fiber filled polyamidimide (PAI), polyphenylene sulfide (PPS) and a thermoset (phenolic). For a room temperature application, PPS and phenolic seem to be the best choice judging from their higher elastic modulus and thus mechanical strength. However, when the service temperature of your application is, for example 130°C a different choice may be more suitable. In this temperature range, PAI is in the lead keeping its high modulus up to 260°C.


Figure 3: DMA of highly filled PAI, PPS and phenolic [1].

Overarching, the most suitable polymer for a certain application obviously depends on the specific application requirements, respectively needed modulus at a certain service temperature or range thereof. As such, the whole DMA curve of a material should be considered during the selection process. In summary, DMA allows you assessing materials’ properties under different circumstances. Material selection has a lot to do with thinking in relationships of time-dependency and temperature-dependency behaviors which can be shown better graphically. Single point data on materials’ technical data sheets (e.g. modulus value at 23 ºC) can lead to misjudgment and negatively impact the material selection process.


Thus, whenever in a discussion with a material supplier or design engineer, discuss how selected materials behave over a wide range of temperatures for instances.

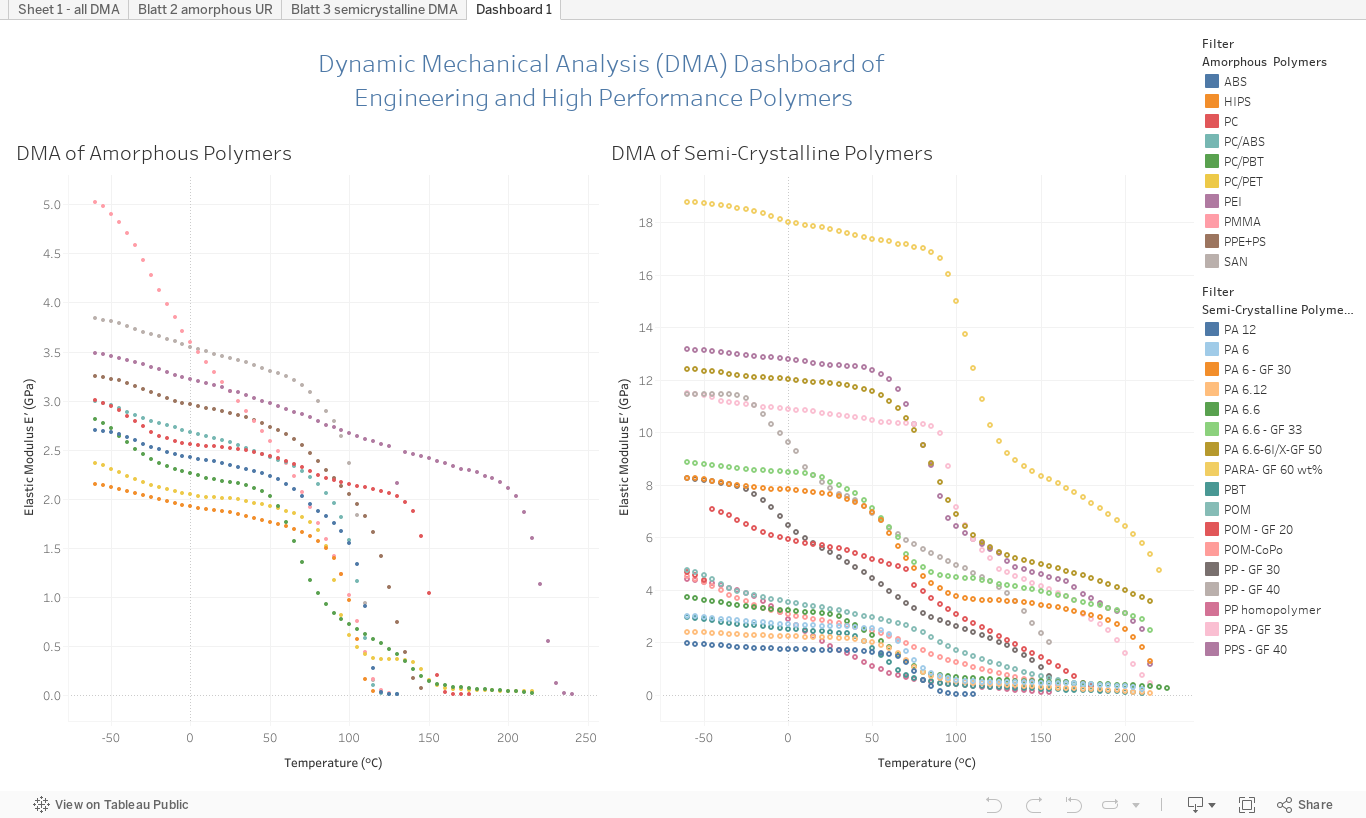
I made an interactive Tableau dashboard which shows the elastic modulus over temperature of amorphous and semi-crystalline polymers (partly also with reinforcements). You can download it and use it for your next polymer material selection project. 


I hope this method is useful and helps you in your material selection.


Thanks for reading & till next time!

Greetings

Herwig Juster

Interested in my monthly blog posts – then subscribe here and receive my high performance polymers knowledge matrix.

!NEW! Ultra and High Performance Polymer Selection - new online course coming soon - join the waiting list

Literature:
[1] M. Sepe - Thermal Analysis of Polymers, Rapra Technology, Shawbury, U.K., 1999
[2] PerkinElmer - Dynamic Mechanical Analysis Basics: Part 2 Thermoplastic Transitions and Properties